


Continuous variation: data handling and analysis


Lesson details
Learning outcome
I can plot data on continuous variation on a histogram and suggest possible causes for the variation.
Key learning points
- Using a histogram or line graph to display continuous data.
- Plotting data for continuous variation on a histogram.
- Interpreting and describing a histogram displaying data for continuous variation.
- Continuous variation is usually influenced by many factors, including genetics, the environment and lifestyle.
Keywords
Continuous variation - Variation which can take any one of many values over a continuous range.
Line graph - A graph displaying continuous data plotted as points joined with a line.
Histogram - A graph displaying continuous data grouped into ranges and plotted as columns that touch.
Environment - Factors in an organism’s surroundings that influence its features.
Genetic - Related to the genetic material (DNA) and genes that an individual has.
Common misconception
Using a bar chart to plot continuous data. Features with continuous variation are only due to genetic factors.
The lesson explores why a histogram or line graph is the correct choice for plotting discontinuous data, and the idea that continuous variation is usually influenced by many factors, including genetics, the environment and lifestyle.
Teacher tip
Students should plot a histogram of their own data that they collected in the previous lesson if possible. Alternatively, sample data is provided for plotting.

Licence

Lesson video
Loading...
Prior knowledge starter quiz
6 Questions
Q1.Which two pieces of equipment should you use when drawing a graph?




Q2.How many students in this class can only roll their tongue into a straw shape?
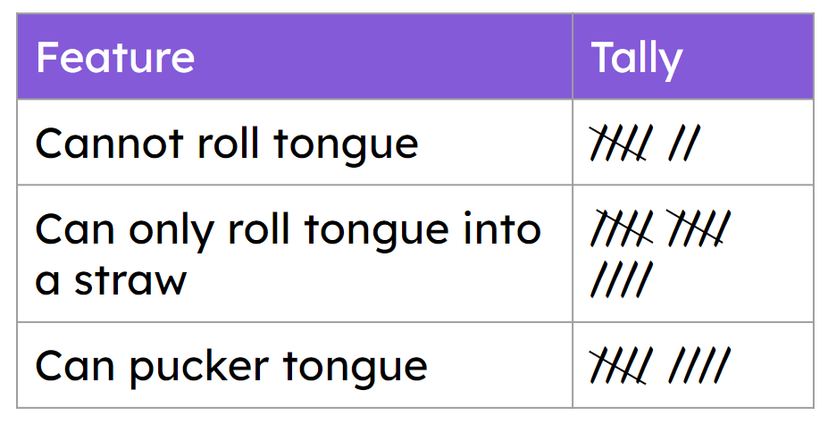
Q3.How many students in this class cannot roll their tongue?
Q4.The peas produced by pea plants can either be smooth or wrinkled. This is an example of variation.
Q5.Data for discontinuous variation should always be plotted on a ...
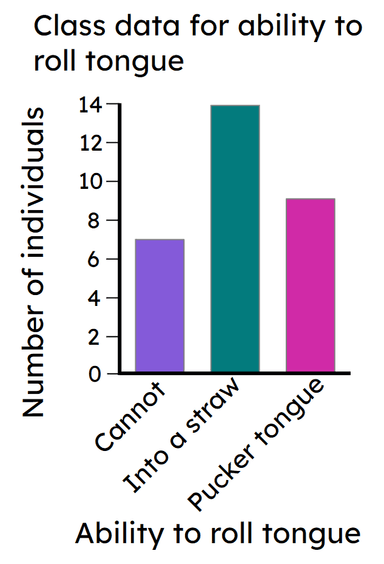
Q6.Which two of the statements below are conclusions that could be drawn from the data in the bar chart?
Assessment exit quiz
6 Questions
Q1.How many students have a height that is in the range of 160 to 169 cm?
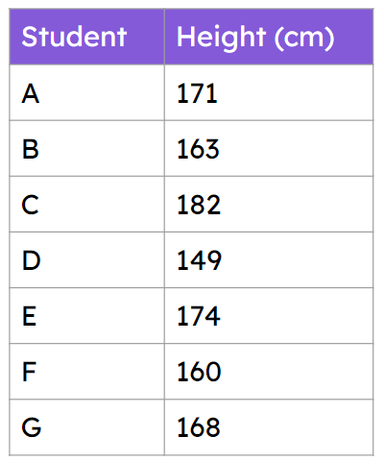
Q2.Which type of graph has this data been displayed in?
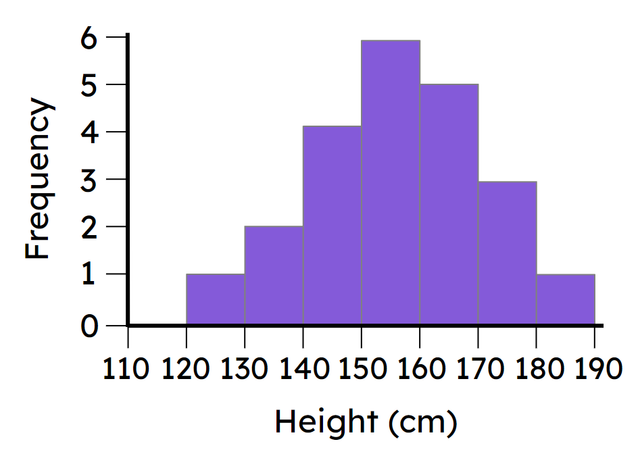
Q3.Height is an example of variation.
Q4.Match each type of graph to its correct feature.

Q5.Which of the following conclusions could be drawn from the histgram shown?
Q6.Data for the height of oak trees shows continuous variation. Which type of factors are likely to influence the height of an oak tree?
To help you plan your 8 science lesson on: Continuous variation: data handling and analysis, download all teaching resources for free and adapt to suit your pupils' needs...
To help you plan your 8 science lesson on: Continuous variation: data handling and analysis, download all teaching resources for free and adapt to suit your pupils' needs.
The starter quiz will activate and check your pupils' prior knowledge, with versions available both with and without answers in PDF format.
We use learning cycles to break down learning into key concepts or ideas linked to the learning outcome. Each learning cycle features explanations with checks for understanding and practice tasks with feedback. All of this is found in our slide decks, ready for you to download and edit. The practice tasks are also available as printable worksheets and some lessons have additional materials with extra material you might need for teaching the lesson.
The assessment exit quiz will test your pupils' understanding of the key learning points.
Our video is a tool for planning, showing how other teachers might teach the lesson, offering helpful tips, modelled explanations and inspiration for your own delivery in the classroom. Plus, you can set it as homework or revision for pupils and keep their learning on track by sharing an online pupil version of this lesson.
Explore more key stage 3 science lessons from the Variation (differences within species) unit, dive into the full secondary science curriculum, or learn more about lesson planning.