

These resources will be removed by end of Summer Term 2025.
Switch to our new teaching resources now - designed by teachers and leading subject experts, and tested in classrooms.
These resources were created for remote use during the pandemic and are not designed for classroom teaching.
Lesson details
Key learning points
- In this lesson, we will learn how to calculate the mean of a set of data displayed in a grouped frequency table.
Licence
This content is made available by Oak National Academy Limited and its partners and licensed under Oak’s terms & conditions (Collection 1), except where otherwise stated.
Loading...
3 Questions
Q1.
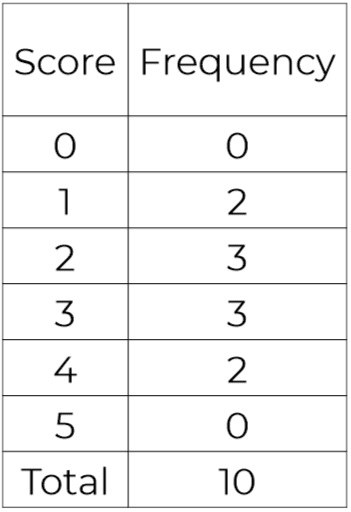
Calculate the mean number of score.
1
3
Q2.
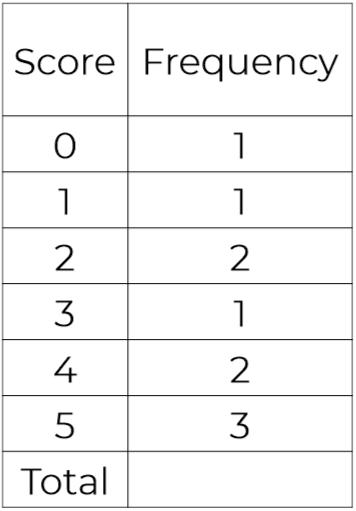
Calculate the mean score.
1
1.5
3.2
Q3.
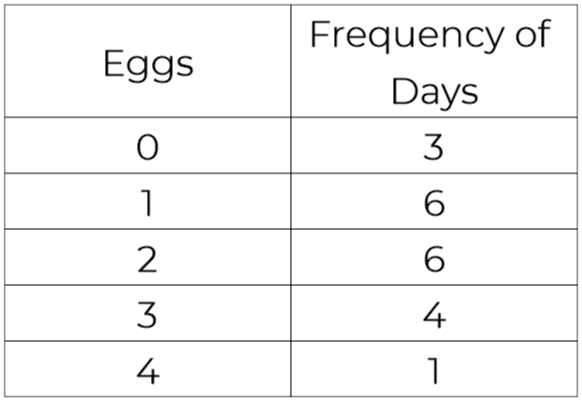
Calculate the mean number of eggs laid each day.
1.6
1.85
2
3 Questions
Q1.
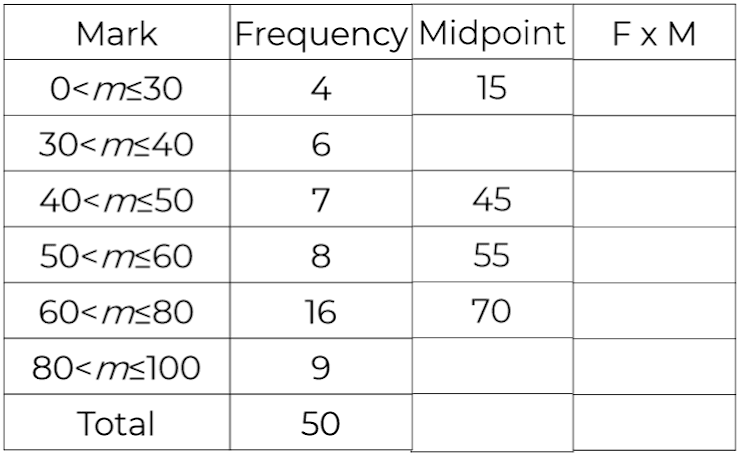
Calculate the mean mark from the grouped frequency table.
2995
50
9.5
Q2.
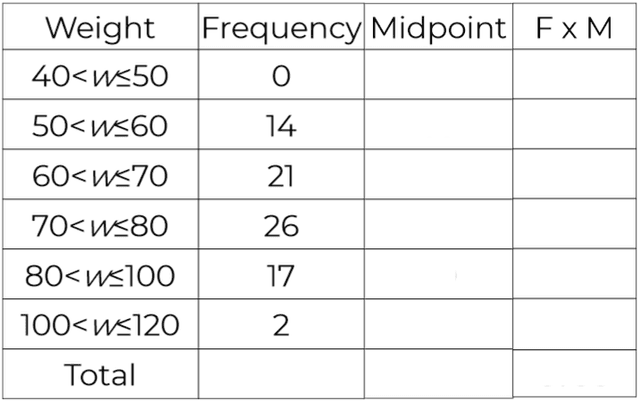
Calculate the mean weight from the grouped frequency table, to 1 decimal place.
13.4
5835
Q3.
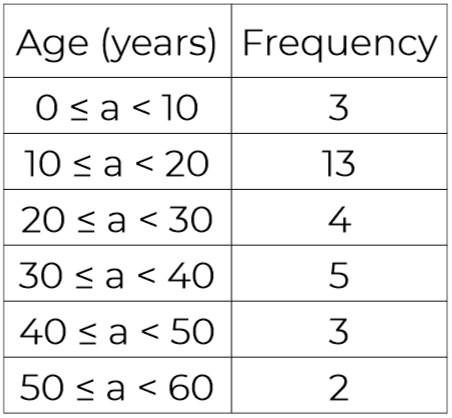
Calculate the mean age from the grouped frequency table, to 1 decimal place.
4.05
730