

These resources will be removed by end of Summer Term 2025.
Switch to our new teaching resources now - designed by teachers and leading subject experts, and tested in classrooms.
These resources were created for remote use during the pandemic and are not designed for classroom teaching.
Lesson details
Key learning points
- In this lesson, we will interpret graphs of quadratic equations in order to find their solutions. We will investigate the key features of quadratic graphs that help us identify their solutions.
Licence
This content is made available by Oak National Academy Limited and its partners and licensed under Oak’s terms & conditions (Collection 1), except where otherwise stated.
Loading...
4 Questions
Q1.
True or False, here is the graph of 2x²+ 1?
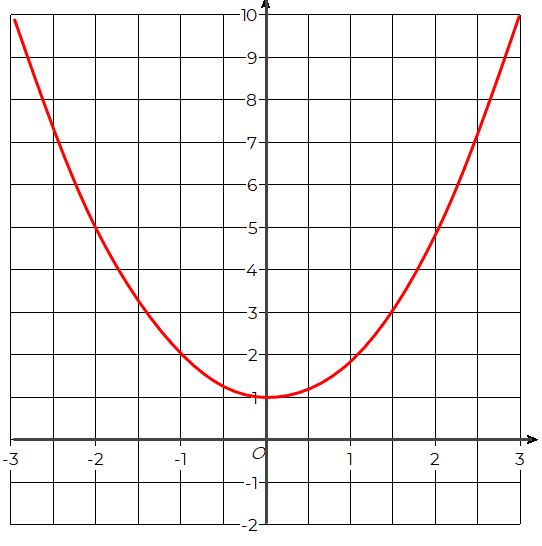
True
Q2.
Here are four quadratic graphs. The red curve shows y = x². Which equation is the yellow curve labelled i?
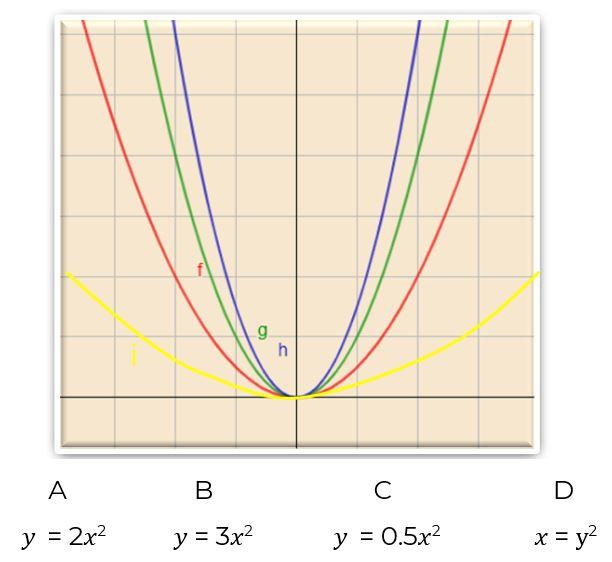
A
B
D
Q3.
Here is a table of values for y = 3x²– 1 Which number is missing?
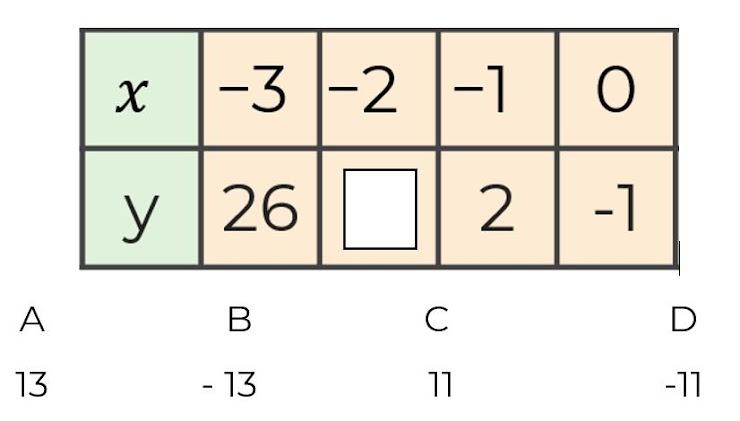
A
B
D
Q4.
Which option is true for f(x)= 0.5x² - 1 ?
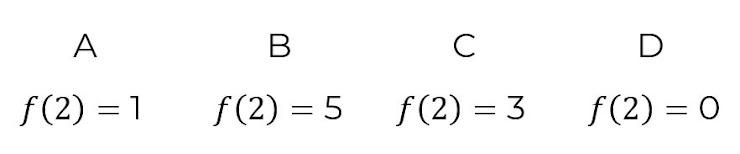
B
C
D
4 Questions
Q1.
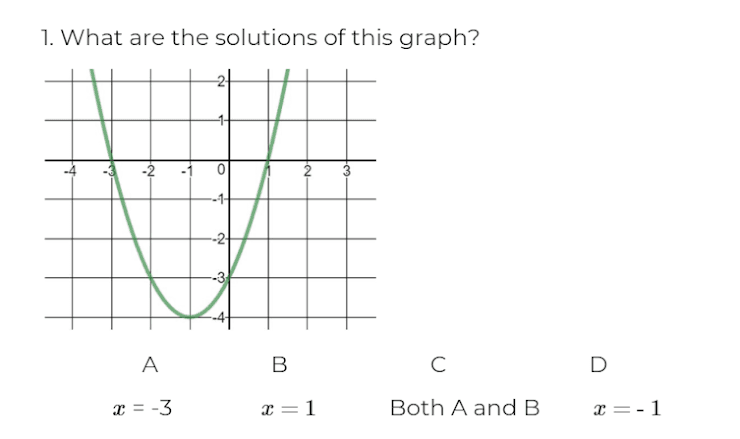
A
B
D
Q2.
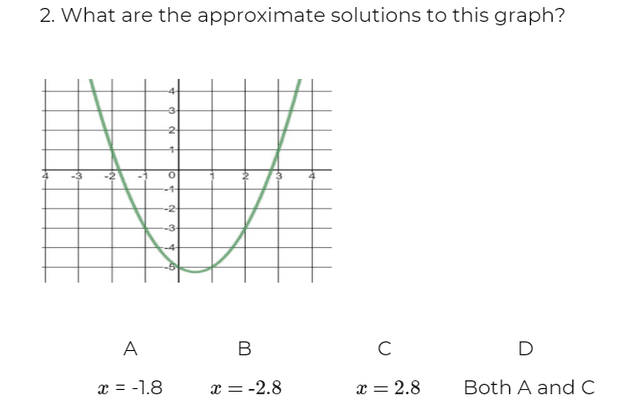
A
B
C
Q3.
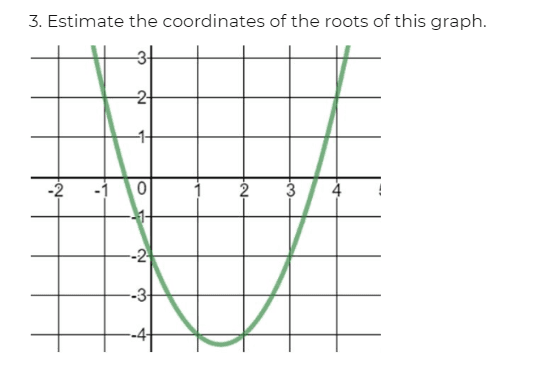
(-0.5, 0)
(0.5, 0) and (3.5, 0)
(0.5, 3.5)
Q4.
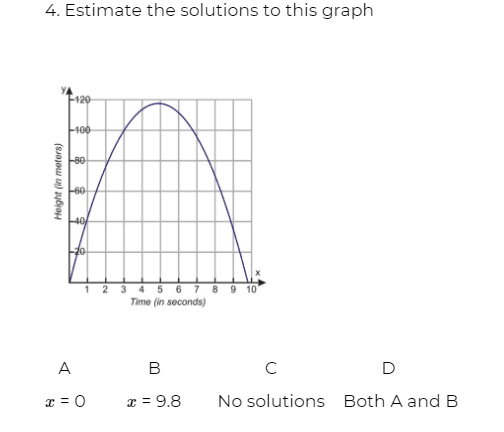
A
B
C