Year 5
These resources will be removed by end of Summer Term 2025.
Switch to our new teaching resources now - designed by teachers and leading subject experts, and tested in classrooms.
These resources were created for remote use during the pandemic and are not designed for classroom teaching.
Lesson details
Key learning points
- In this lesson, we will be reviewing the entire unit of line graphs and timetables by completing a series of challenges and problems based on the different concepts taught across all of the lessons throughout the unit. This lesson can be watched in its entirety or specific sections can be visited if pupils wish to focus their learning and consolidation on a specific concept.
Licence
This content is made available by Oak National Academy Limited and its partners and licensed under Oak’s terms & conditions (Collection 1), except where otherwise stated.
5 Questions
Q1.
When deciding the correct scale to use in the construction of a line graph, which of the following statements is important to remember?
The Y-axis scale can never use negative numbers
The Y-axis scale can only ever go up in even numbers
The Y-axis scale has to begin on 0
Q2.
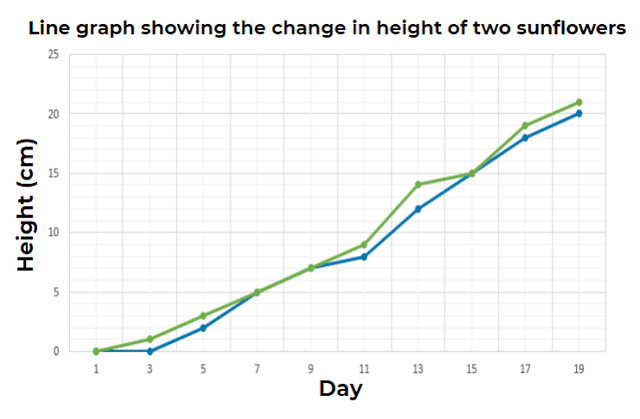
Look carefully at the line graph below. What is wrong with it?

The scale is incorrect
The title is incorrect and doesn't represent the data
The x and y axes are incorrectly labelled
Q3.
When using the conversion graph during the lesson, what exchange rate did we use converting between dollars $ and pounds £?
$30 ≈ £35
$40 ≈ £25
$40 ≈ £50
Q4.
When trying to work out the correct interval of time between two given clock times, which strategy was suggested as an effective one to use?
A bar model
Column addition
Column subtraction
Q5.
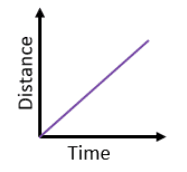
The simple line graph below shows the journey of a family as they drive down the motorway on the way to their caravan for a holiday. What word best describes the speed of the car they are driving in?

Fast
Increasing
Varied

