

Year 6
These resources will be removed by end of Summer Term 2025.
Switch to our new teaching resources now - designed by teachers and leading subject experts, and tested in classrooms.
These resources were created for remote use during the pandemic and are not designed for classroom teaching.
Lesson details
Key learning points
- In this lesson, we will explore discrete and cumulative data and interpret different types of line graphs.
Licence
This content is made available by Oak National Academy Limited and its partners and licensed under Oak’s terms & conditions (Collection 1), except where otherwise stated.
4 Questions
Q1.
Calculate the mean of the data set below.

140
5
Q2.
Calculate the mean of the data set below.

6
84
Q3.
The data below shows the amount of time 6 pupils took to read one chapter of a book. Calculate the mean time taken to read the chapter, giving your answer to the nearest minute.
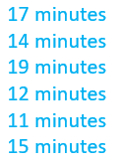
14
88
Q4.
The mean of the five number cards below is 9. What is the missing number?

38
45
4 Questions
Q1.
Approximately how far had Metila run after 26 minutes?

4 km
6 km
Q2.
How long did it take for Metila to run 10km?
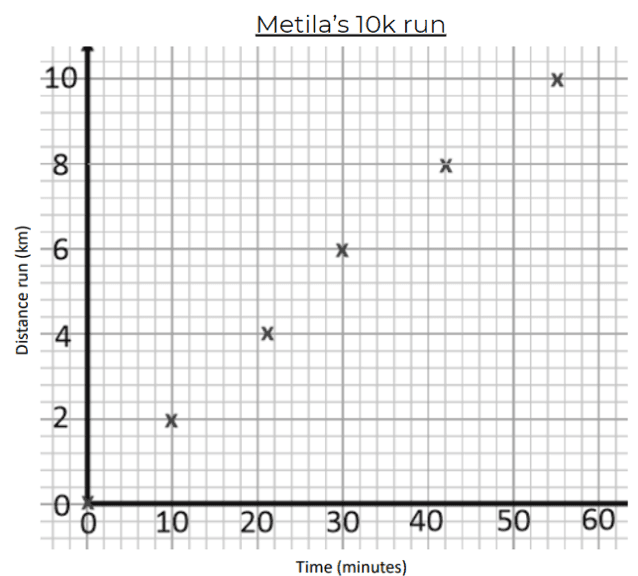
54 minutes
56 minutes
Q3.
What is the average temperature in July?
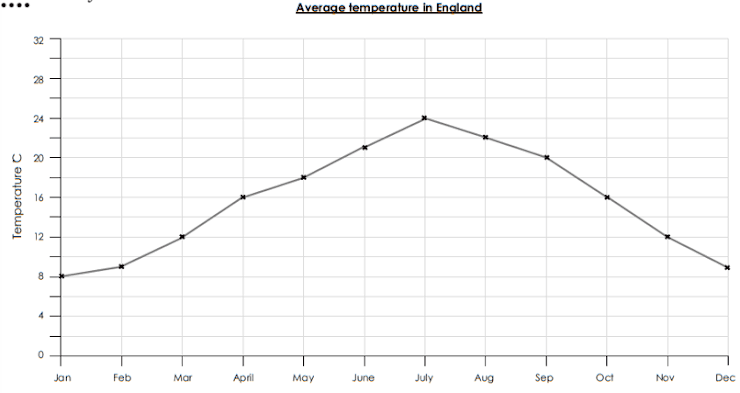
22⁰C
23⁰C
Q4.
In which months was the average temperature 9⁰C?

January