

Year 11
Core
Probability from a venn diagram using further set notation (2 sets)
Year 11
Core
Probability from a venn diagram using further set notation (2 sets)
These resources will be removed by end of Summer Term 2025.
Switch to our new teaching resources now - designed by teachers and leading subject experts, and tested in classrooms.
These resources were created for remote use during the pandemic and are not designed for classroom teaching.
Lesson details
Key learning points
- In this lesson, we will interpret Venn diagrams with two sets and find probabilities, including conditional probabilities from them, using the correct set notation.
Licence
This content is made available by Oak National Academy Limited and its partners and licensed under Oak’s terms & conditions (Collection 1), except where otherwise stated.
Loading...
3 Questions
Q1.
The two-way table shows information about year 7 and 8 students and their participation in some school clubs. How do you find the total number of students?
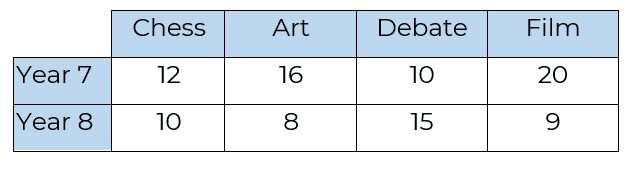
Find the difference between the students in year 7 and the students in year 8 for each club in the table.
Multiply all the numbers in each row.
Q2.
The two-way table shows information about year 7 and 8 students and their participation in some school clubs. What is the probability that two students picked at random attend debate club?
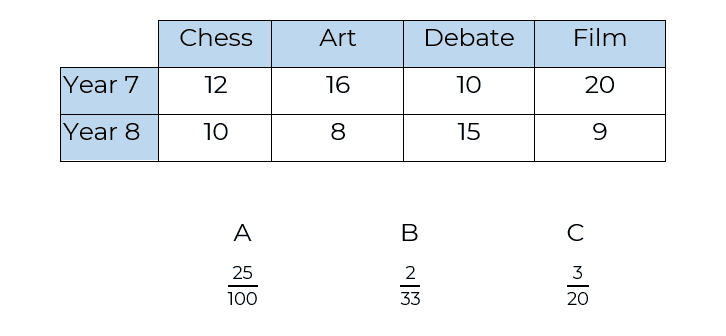
A
C
Q3.
The two-way table shows information about year 7 and 8 students and their participation in some school clubs. What is the probability that two students picked at random attend chess club and one is in year 7 and the other in year 8?
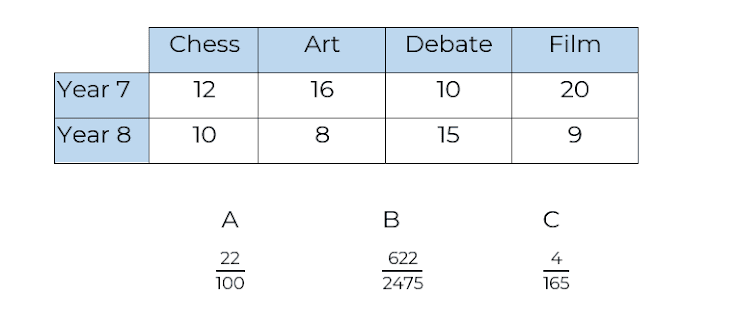
A
B
3 Questions
Q1.
Use Venn diagram to calculate P(A’∪ B’)
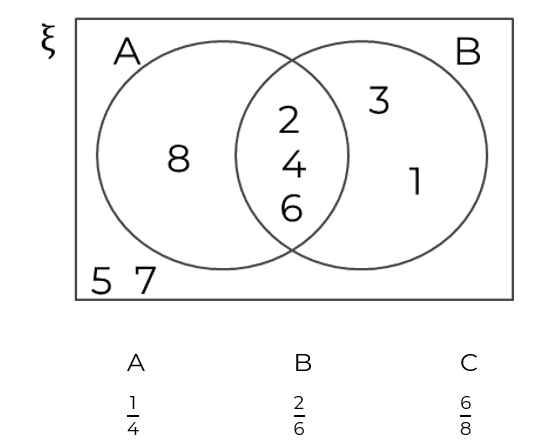
B
C
Q2.
Use Venn diagram to calculate P(A ∩ B | B)
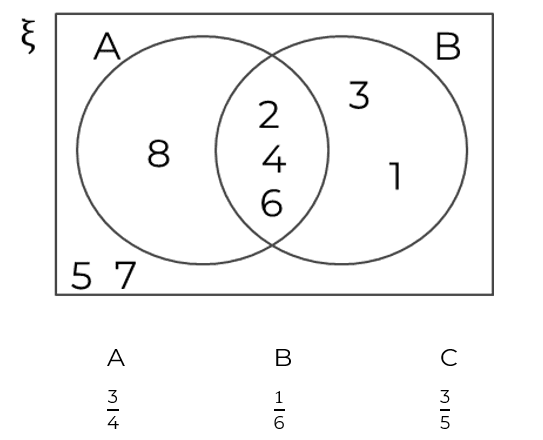
A
B
Q3.
Use Venn diagram to calculate P(A ∩ B | A)
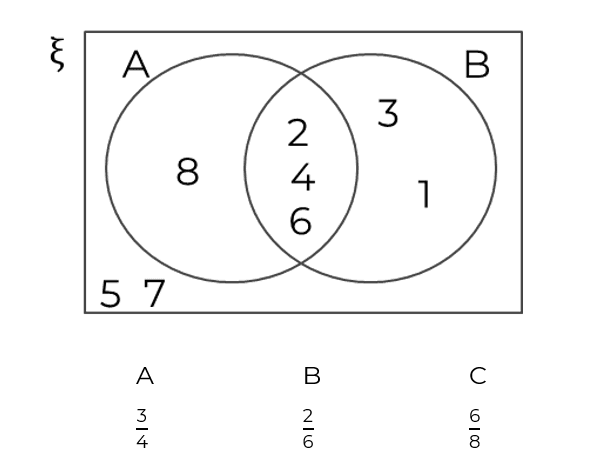
B
C