

Year 10
Core
Calculate experimental probabilities and make predictions (relative frequency)
Year 10
Core
Calculate experimental probabilities and make predictions (relative frequency)
These resources will be removed by end of Summer Term 2025.
Switch to our new teaching resources now - designed by teachers and leading subject experts, and tested in classrooms.
These resources were created for remote use during the pandemic and are not designed for classroom teaching.
Lesson details
Key learning points
- In this lesson, we will learn how to record data in a relative frequency table and use the probabilities to make predictions, including scenarios such as spinners or rolling dice.
Licence
This content is made available by Oak National Academy Limited and its partners and licensed under Oak’s terms & conditions (Collection 1), except where otherwise stated.
Loading...
3 Questions
Q1.A dice is rolled and a fair coin is tossed. Use the table to find the probability of getting an odd number and a tail.
A dice is rolled and a fair coin is tossed. Use the table to find the probability of getting an odd number and a tail.
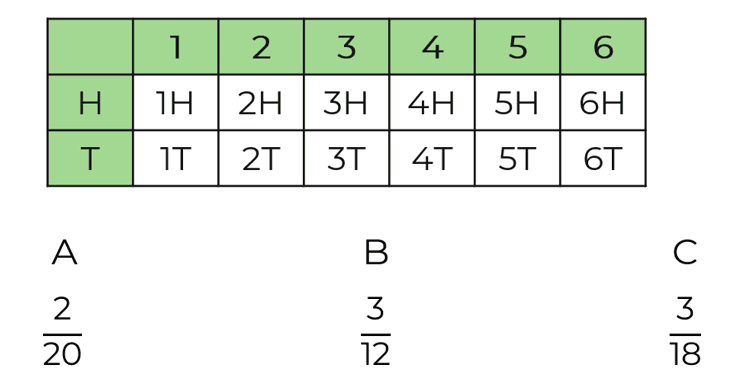
A
C
Q2.Students in year 7 were asked how they travelled to school. Work out the probability a student who travels by bus is selected.
Students in year 7 were asked how they travelled to school. Work out the probability a student who travels by bus is selected.
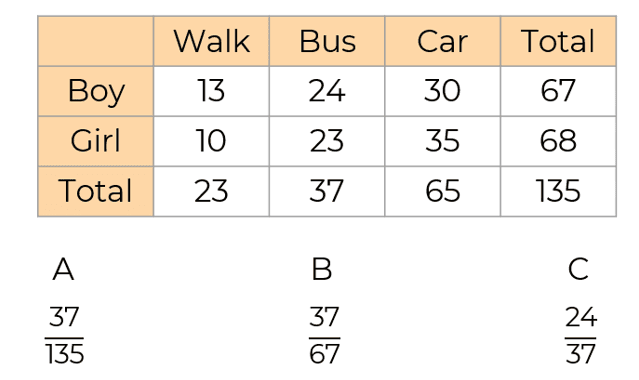
B
C
Q3.Students in year 7 were asked how they travelled to school. Work out the probability of selecting a girl who doesn’t walk is selected.
Students in year 7 were asked how they travelled to school. Work out the probability of selecting a girl who doesn’t walk is selected.
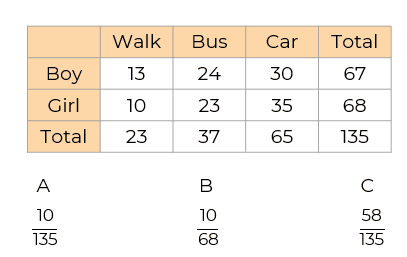
A
B
3 Questions
Q1.Marion rolls a dice thirty times and records the information in a relative frequency table. How could she make her experiment more reliable?
Marion rolls a dice thirty times and records the information in a relative frequency table. How could she make her experiment more reliable?
Repeat the experiment and compare her results to the first experiment
Roll the dice 10 times and record her results
Use theoretical probabilities
Q2.
B
C
D
Q3.A spinner labelled A, B, C and D is spun 20 times. The relative frequencies are in the table below. Which statement is not true?
A spinner labelled A, B, C and D is spun 20 times. The relative frequencies are in the table below. Which statement is not true?
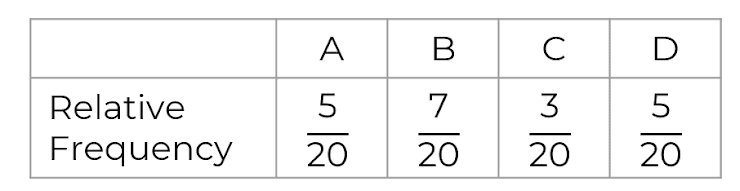
A and D occurred the same number of times.
B occurred the most frequently.
It is difficult to say whether the spinner is biased because there have only been 20 trials.