

Year 11
Foundation
Year 11
Foundation
Draw a tree diagram for dependent events
These resources will be removed by end of Summer Term 2025.
Switch to our new teaching resources now - designed by teachers and leading subject experts, and tested in classrooms.
These resources were created for remote use during the pandemic and are not designed for classroom teaching.
Lesson details
Key learning points
- In this lesson, we will learn how to draw tree diagrams and complete missing probabilities in tree diagrams for dependent events.
Licence
This content is made available by Oak National Academy Limited and its partners and licensed under Oak’s terms & conditions (Collection 1), except where otherwise stated.
Loading...
3 Questions
Q1.
For the probability tree shown, which calculation will find the probability of red followed by blue happening?
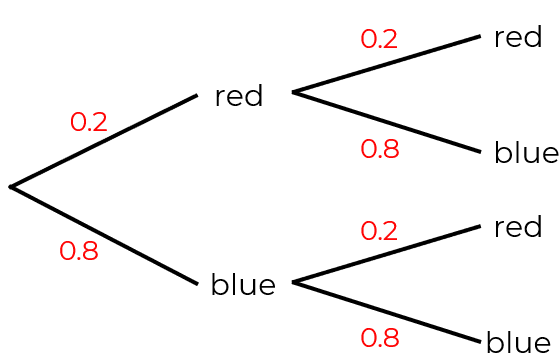
0.2 + 0.2
0.2 x 0.2
0.8 x 0.8
Q2.
The probability that Amy and Joe win a game of chess is shown in the tree diagram. Work out the probability that over 2 games Amy wins twice.
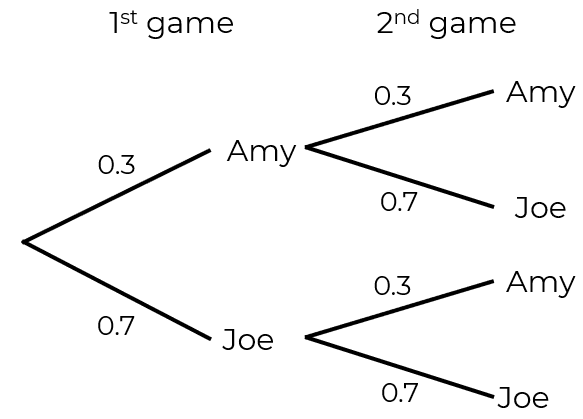
0.49
0.6
0.9
Q3.
James draws this probability tree diagram to help him calculate probabilities of taking sweets from a bag. What assumptions has James made when completing this probability tree?
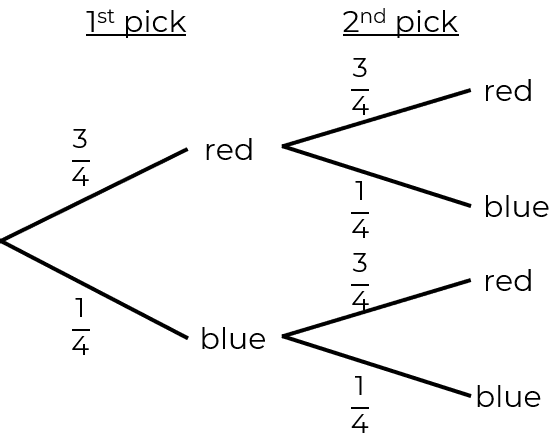
All probabilities add to 1 on each branch.
It doesn’t matter if he eats the first sweet he takes.
3 Questions
Q1.
Probability of a dependent event is also called?
Biased probability.
Mutually exclusive.
Random probability.
Q2.
Simon has drawn this probability tree for a question on dependent probability. What mistake has he made?
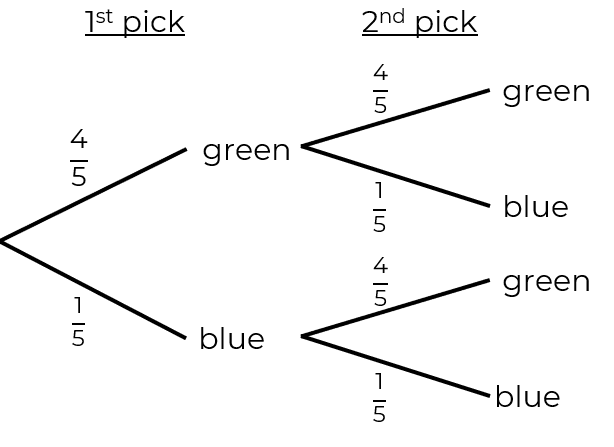
The fractions on each branch do not sum to 1.
The probabilities should be decimals.
Q3.
This tree diagram shows Amir taking red and blue sweets from a bag. He does not replace the sweet after he has taken one.
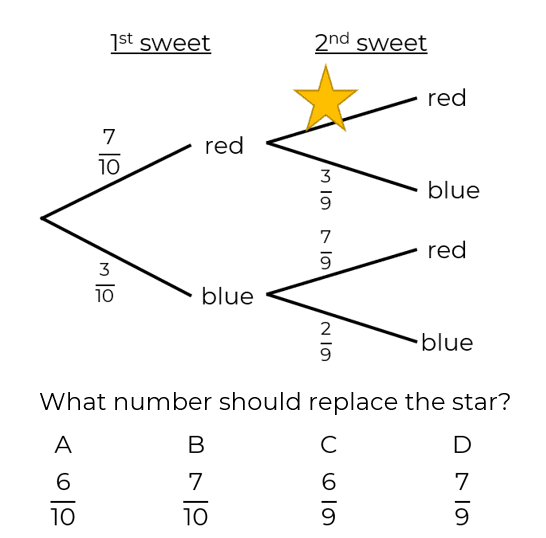
A
B
D