

Year 10
Higher
Year 10
Higher
Plot a box plot and compare distributions
These resources will be removed by end of Summer Term 2025.
Switch to our new teaching resources now - designed by teachers and leading subject experts, and tested in classrooms.
These resources were created for remote use during the pandemic and are not designed for classroom teaching.
Lesson details
Key learning points
- In this lesson, we will construct box plots and read data from them including comparing data from two or more distributions
Licence
This content is made available by Oak National Academy Limited and its partners and licensed under Oak’s terms & conditions (Collection 1), except where otherwise stated.
Loading...
3 Questions
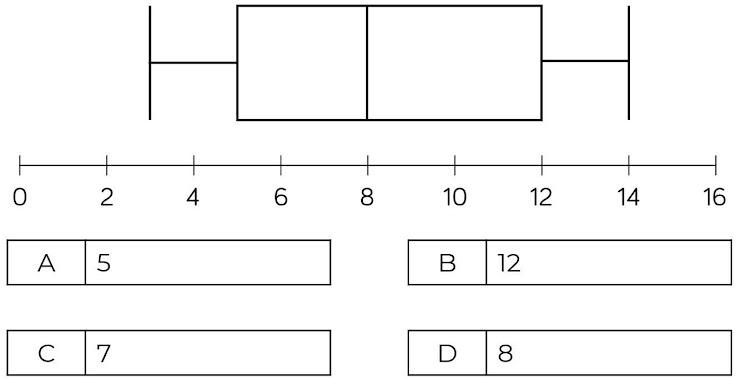
Q1.
What is the median of this set of data?
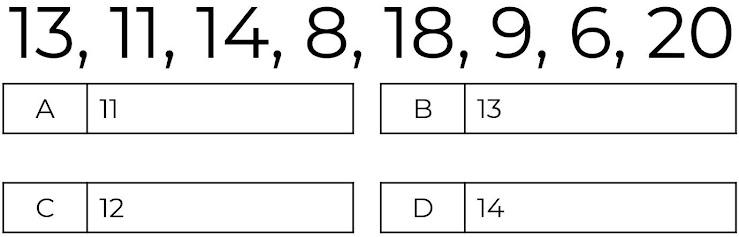
A
B
D
Q2.
What is the lower quartile of this data set?
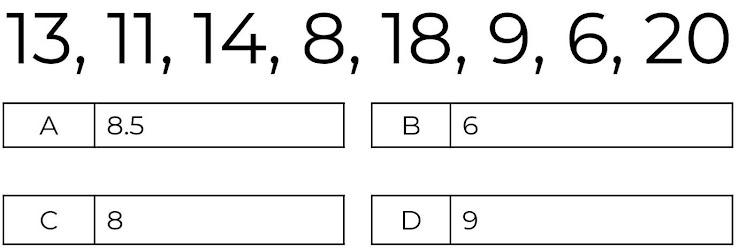
B
C
D
Q3.
What is the upper quartile of this data set?
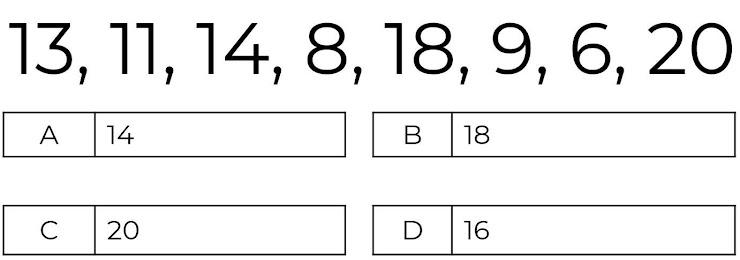
A
B
C
3 Questions
Q1.
What is the median?
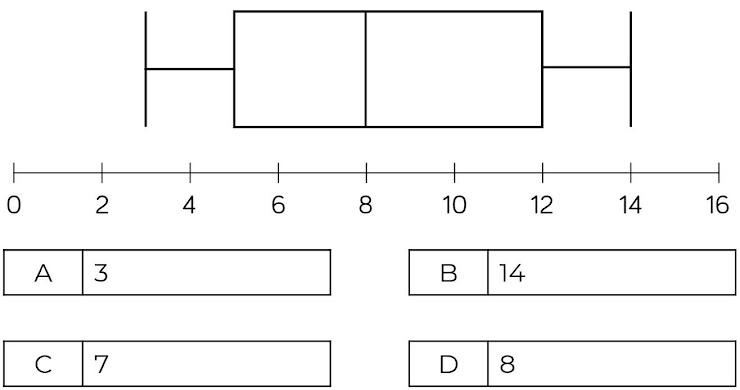
A
B
C
Q2.
What is the interquartile range?
A
B
D
Q3.
What is the range?
B
C
D