

Year 11
Higher
These resources will be removed by end of Summer Term 2025.
Switch to our new teaching resources now - designed by teachers and leading subject experts, and tested in classrooms.
These resources were created for remote use during the pandemic and are not designed for classroom teaching.
Lesson details
Key learning points
- In this lesson, we will learn how to find probabilities from a histogram by finding the frequencies represented by each bar and the vertical scale.
Licence
This content is made available by Oak National Academy Limited and its partners and licensed under Oak’s terms & conditions (Collection 1), except where otherwise stated.
Loading...
3 Questions
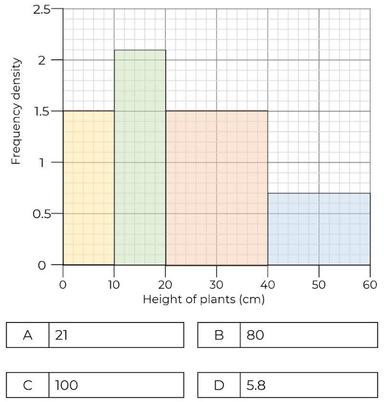
Q1.
What is the total frequency?
A
C
D
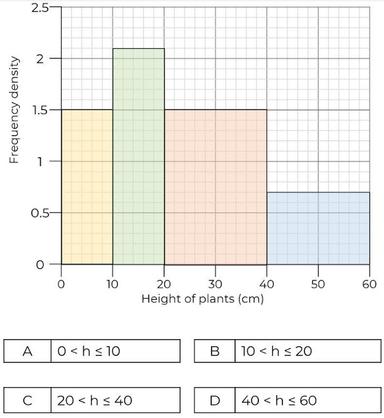
Q2.
Which class interval contains the median?
A
B
D
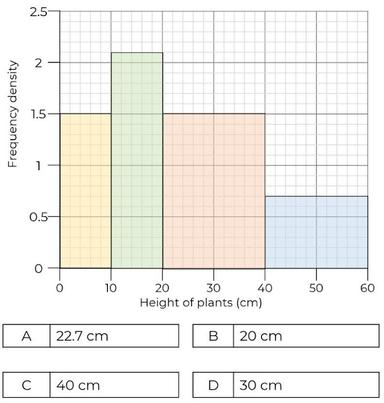
Q3.
What is the estimate median?
B
C
D
3 Questions
Q1.
What is the probability a plant chosen at random is less than 10 cm?
B
C
D
Q2.
What is the probability a plant chosen at random is more than 20 cm?
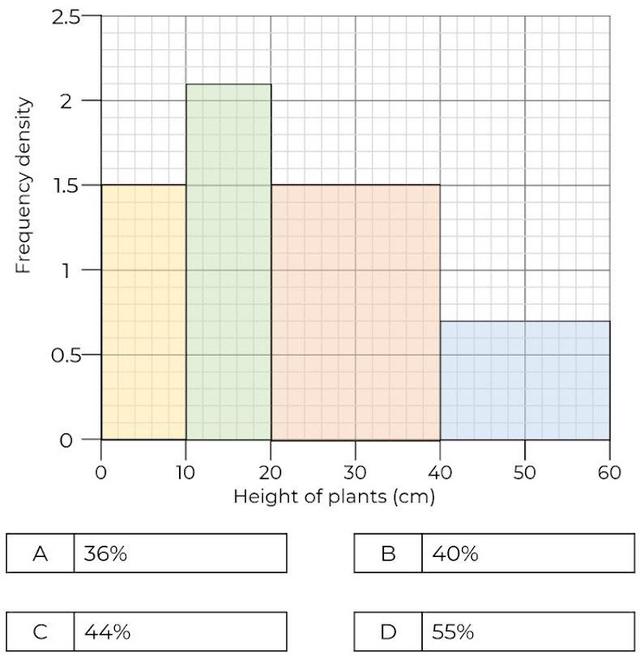
A
B
C
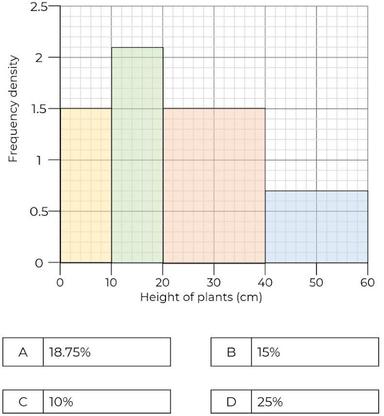
Q3.
What is an estimate for the probability that a randomly selected plant is over 30 cm tall?
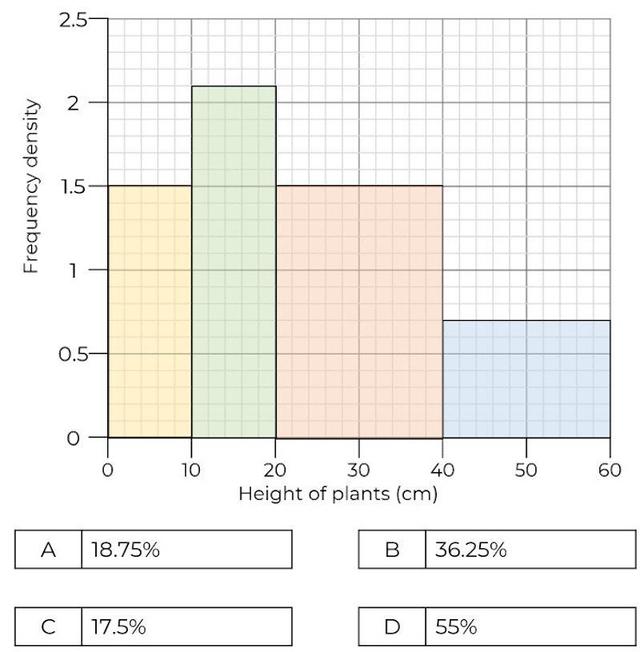
A
C
D