


Reading distance-time graphs



Lesson details
Learning outcome
I can read values of distance and time from graphs and use them to calculate speed.
Key learning points
- The labels on a graph describe what it shows.
- The numbers on the scale of a graph go up in equal amounts.
- The value of each small division is the value of a large division divided by the number of small divisions it contains.
- Each point on a distance-time graph describes where an object is at a point in time (not its speed).
- The speed of an object can be found from distance and time information read from a distance-time graph.
Keywords
Distance-time graph - A distance-time graph is used to show how far an object has travelled over a period of time.
Axis - The horizontal axis on a distance-time graph shows the time and the vertical axis shows the distance.
Scale - Each axis has a scale which shows the variable name and the minimum and maximum values.
Division - Scales are marked with divisions so that values can be read from the distance-time graph.
Average speed - The overall distance travelled divided by overall time for a journey.
Common misconception
Pupils often interpret distance-time graphs (intuitively) as pictures.
Guide pupils step by step through interpreting d-t graphs and link each line with a motion (repeatedly).
Teacher tip
Students find interpreting d-t graphs difficult so model movement, towards and away from a point, as much as possible. "Live" graph distance sensors are very useful and can show different gradients for different speeds.

Content guidance
Risk assessment required - equipment

Supervision
Adult supervision required

Licence

Lesson video
Loading...
Prior knowledge starter quiz
6 Questions
Q1.Match the symbol for the unit with the property it is used to measure.

Q2.Which two pieces of equipment could be used to find the speed of a trolley rolling down a ramp?
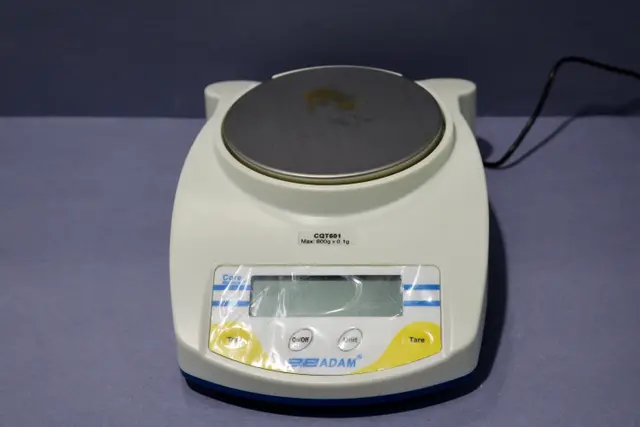
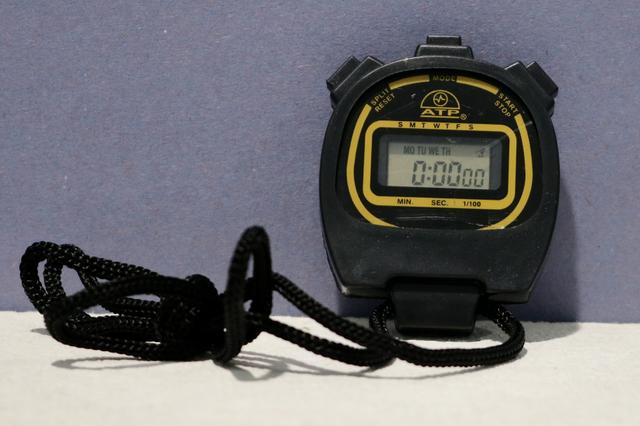
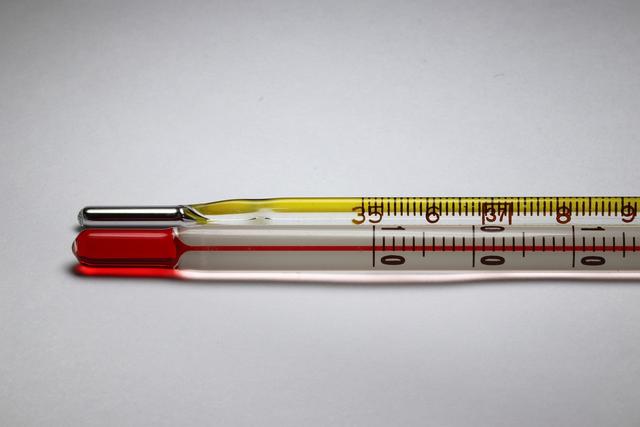
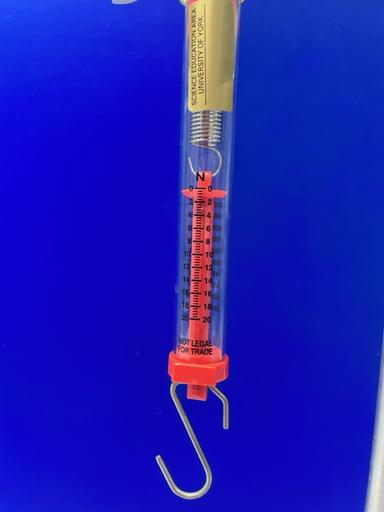
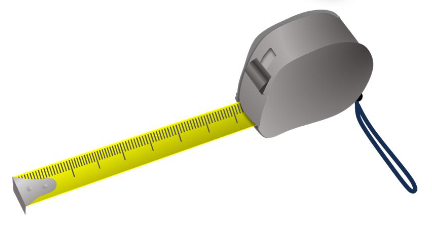
Q3.Calculate the distance a bicycle travelling at 6.0 m/s will travel in 30 s.
Q4.A runner completes an 800 m race with an average speed of 6.4 m/s. How long did it take to finish the race?
Q5.A trolley is rolled a distance of 3.0 m, taking 6.0 s to cover the distance. What is the average speed of the trolley?
Q6.Starting with the fastest, put the values in order of average speed.
Assessment exit quiz
6 Questions
Q1.Match the keyword to the description.
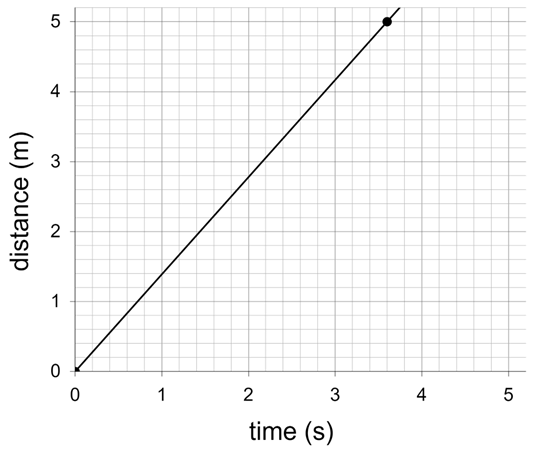
Q2.What distance has this object travelled after 3 s? Don’t forget to provide the unit in your answer.
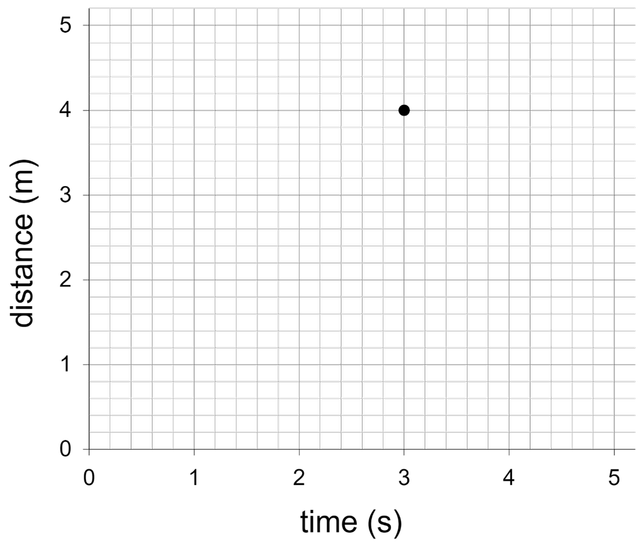
Q3.Which feature of this graph shows that the object is travelling at a constant speed?
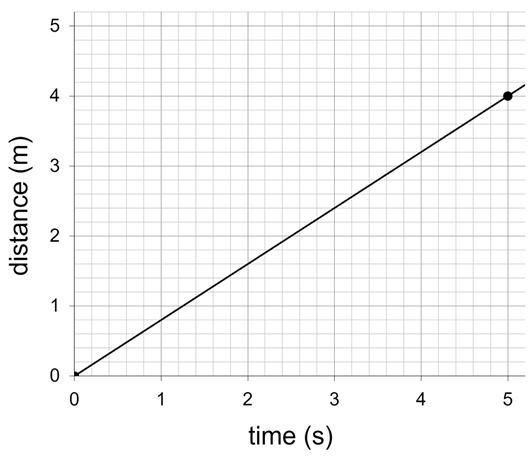
Q4.How long does it take for this object to travel 5 m? Give your answer to one decimal place. Don’t forget to provide the unit in your answer.
Q5.Use the graph to find the average speed of this object.
Q6.What distance does this object travel between 1 s and 4 s? Don’t forget to provide the unit in your answer.
To help you plan your 8 science lesson on: Reading distance-time graphs, download all teaching resources for free and adapt to suit your pupils' needs...
To help you plan your 8 science lesson on: Reading distance-time graphs, download all teaching resources for free and adapt to suit your pupils' needs.
The starter quiz will activate and check your pupils' prior knowledge, with versions available both with and without answers in PDF format.
We use learning cycles to break down learning into key concepts or ideas linked to the learning outcome. Each learning cycle features explanations with checks for understanding and practice tasks with feedback. All of this is found in our slide decks, ready for you to download and edit. The practice tasks are also available as printable worksheets and some lessons have additional materials with extra material you might need for teaching the lesson.
The assessment exit quiz will test your pupils' understanding of the key learning points.
Our video is a tool for planning, showing how other teachers might teach the lesson, offering helpful tips, modelled explanations and inspiration for your own delivery in the classroom. Plus, you can set it as homework or revision for pupils and keep their learning on track by sharing an online pupil version of this lesson.
Explore more key stage 3 science lessons from the Moving by force unit, dive into the full secondary science curriculum, or learn more about lesson planning.