


New
New
Friction: do and review
I can carry out an investigation into friction and evaluate the results.


Lesson 4 of 13
New
New
- Year 5
Friction: do and review
I can carry out an investigation into friction and evaluate the results.


Lesson details
Key learning points
- Scientists carry out investigations to measure and compare the amount of friction created between different surfaces.
- The results from an investigation can be recorded in different ways, including tables and graphs.
- The findings from an investigation can be summarised into a conclusion.
- Objects experience more friction when moving across rough surfaces compared to smooth surfaces.
- Test results can be used to make predictions to set up further investigations.
Keywords
Surface - The surface is the top or outside layer of an object or material.
Friction - Friction is a force that acts between surfaces.
Variable - A variable is something that can be changed, measured or kept the same in an investigation.
Conclusion - In a conclusion, scientists explain what the results show and what they mean.
Common misconception
All graphs can be used to present all types of data.
Examples given of different types of graph and sample data.
This lesson links directly to the unit's previous lesson (L3) whereby pupils planned a comparative test to find answers to the question: Do different surfaces create different amounts of friction? See video to demonstrate specific aspects of working scientifically linked to this lesson's content.

Teacher tip

Equipment
See additional materials.

Content guidance
- Risk assessment required - equipment

Supervision
Adult supervision required

Licence
This content is © Oak National Academy Limited (2026), licensed on Open Government Licence version 3.0 except where otherwise stated. See Oak's terms & conditions (Collection 2).
Lesson video
Loading...
Prior knowledge starter quiz
6 Questions
Q1.What is the name of the force that acts between objects that are moving, or trying to move, across each other?
What is the name of the force that acts between objects that are moving, or trying to move, across each other?
Q2.How many variables should you change in a controlled investigation, such as in a comparative or fair test?
How many variables should you change in a controlled investigation, such as in a comparative or fair test?
Q3.If the enquiry question is, 'Do different gloves create different amounts of friction?', which variable should be changed?
If the enquiry question is, 'Do different gloves create different amounts of friction?', which variable should be changed?
The weight applied to the glove.
The amount of force applied to pull the glove.
The surface the glove is tested on.
Q4.Which of these is not a way in which scientists present results?
Which of these is not a way in which scientists present results?
graphs
diagrams
tables
Q5.Match the investigation type to the activity.
Match the investigation type to the activity.

Q6.In which direction does friction act on moving objects?
In which direction does friction act on moving objects?
In the same direction as the movement.
At a different angle to the movement.
Assessment exit quiz
6 Questions
Q1.Starting with the least, sort these surfaces in order of increasing amount of friction created when walking across them.
Starting with the least, sort these surfaces in order of increasing amount of friction created when walking across them.
Q2.Which of these is not a type of graph?
Which of these is not a type of graph?
scatter graph
bar chart
line graph
Q3.In which part of an investigation should you summarise the results?
In which part of an investigation should you summarise the results?
prediction
method
introduction
Q4.What do scientists use test results for?
What do scientists use test results for?
to help them choose equipment
Q5.What is this graph missing?
What is this graph missing?
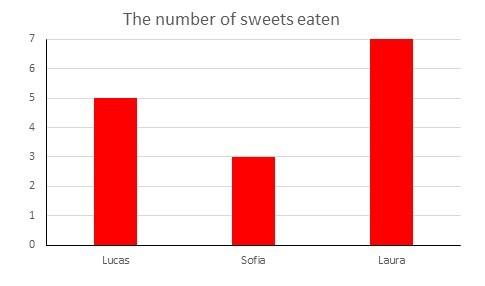
data
title
scale
Q6.Which of these types of data are best shown in a bar chart?
Which of these types of data are best shown in a bar chart?
data showing a change over time
data showing the relationship between two variables
