


Calculate the difference when information is presented in a bar chart


Lesson details
Learning outcome
I can calculate the difference when information is presented in a bar chart.
Key learning points
- A bar chart is a graph that uses bars to represent information.
- Bar charts can have different scales.
- The difference is one of the parts that make the whole. Whole - part = part (difference)
- You can calculate the difference by counting on from the known part to the whole.
Keywords
Bar chart - A graph that uses bars of different heights to represent information.
Difference - The result of subtracting one number from another. Way in which two or more things we are comparing are not the same.
Counting on - A mental strategy used to add numbers.
Subtraction - To partition one part from another (the subtrahend from the difference), or to decrease an amount by taking an amount away.
Common misconception
Children may initially struggle to read and interpret the data on the bar chart / graph.
A ruler can be used to help children line up the top of the bar with the scale. Model this as a strategy to support accurate reading.
Teacher tip
Encourage children to make their own enquiries about the bar charts / graphs within this lesson. What do you notice? What can you tell me about __________? What is the same? What is different?

Licence

Lesson video
Loading...
Prior knowledge starter quiz
6 Questions
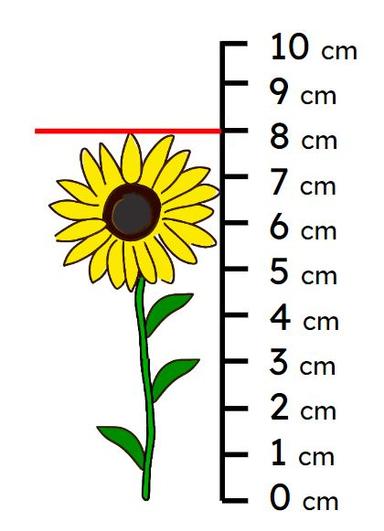
Q1.What is the height of Andeep’s sunflower?
The sunflower is cm tall.

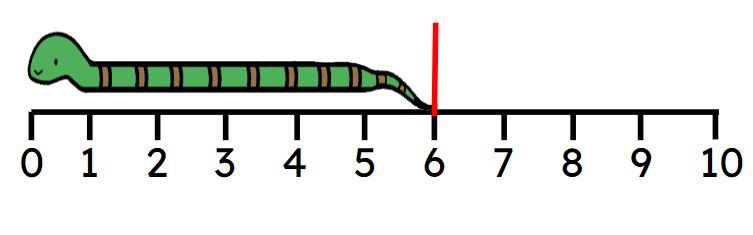
Q2.How long is the snake? The snake is cm long.
Q3.Which of these bars is 12 cm?
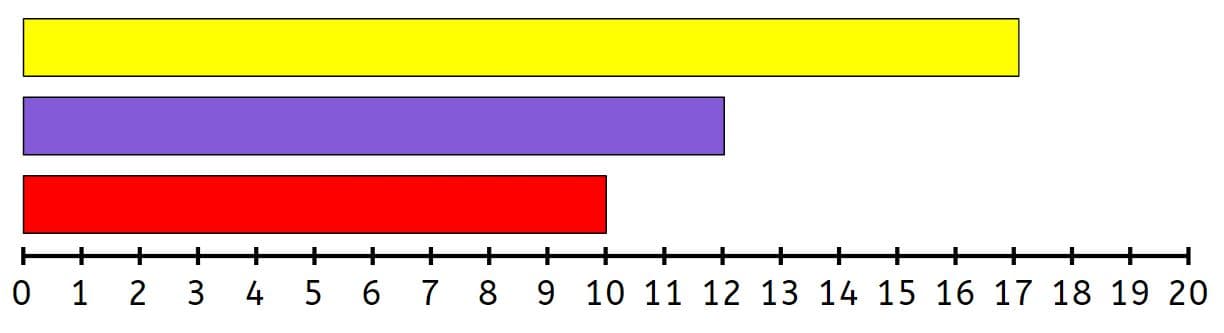
Q4.Which of these bars measures 17 cm?
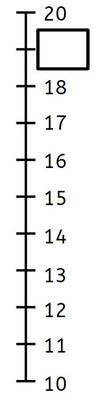
Q5.What number is missing from this number line?

Q6.What number is missing from this number line?
Assessment exit quiz
6 Questions
Q1.Izzy, Sam, Alex and Lucas play a game. They make a bar chart of points scored. How many points did Alex score?
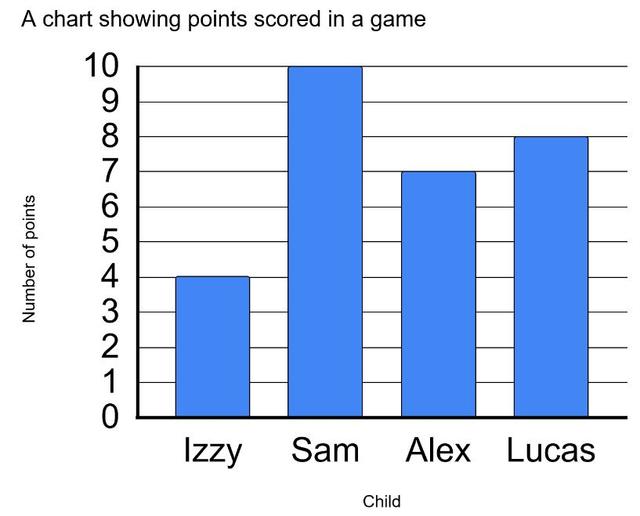
Q2.How many more points did Sam score than Izzy?
Q3.Which two children had a difference of 4 points?
Q4.Laura, Sofia, Jun and Andeep play a game. They record their points in a table and plan to draw a bar chart. Using the table below, state how many points Andeep scored.
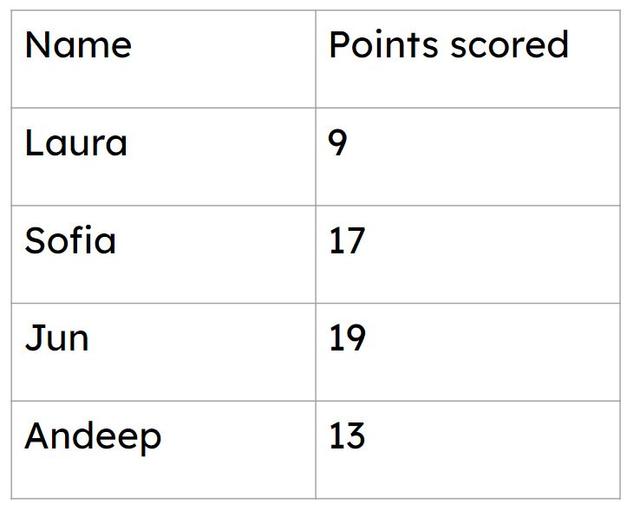
Q5.Look at the table. How many fewer points did Laura score than Jun?
Q6.Look at the table. Which two children had a difference of 2 points?
To help you plan your 2 maths lesson on: Calculate the difference when information is presented in a bar chart, download all teaching resources for free and adapt to suit your pupils' needs...
To help you plan your 2 maths lesson on: Calculate the difference when information is presented in a bar chart, download all teaching resources for free and adapt to suit your pupils' needs.
The starter quiz will activate and check your pupils' prior knowledge, with versions available both with and without answers in PDF format.
We use learning cycles to break down learning into key concepts or ideas linked to the learning outcome. Each learning cycle features explanations with checks for understanding and practice tasks with feedback. All of this is found in our slide decks, ready for you to download and edit. The practice tasks are also available as printable worksheets and some lessons have additional materials with extra material you might need for teaching the lesson.
The assessment exit quiz will test your pupils' understanding of the key learning points.
Our video is a tool for planning, showing how other teachers might teach the lesson, offering helpful tips, modelled explanations and inspiration for your own delivery in the classroom. Plus, you can set it as homework or revision for pupils and keep their learning on track by sharing an online pupil version of this lesson.
Explore more key stage 1 maths lessons from the Calculating within 20 unit, dive into the full primary maths curriculum, or learn more about lesson planning.