

Year 11
Foundation
These resources will be removed by end of Summer Term 2025.
Switch to our new teaching resources now - designed by teachers and leading subject experts, and tested in classrooms.
These resources were created for remote use during the pandemic and are not designed for classroom teaching.
Lesson details
Key learning points
- In this lesson, we will learn how to draw and interpret pie charts from frequency tables. We will learn how to calculate angles that represent each proportion of data.
Licence
This content is made available by Oak National Academy Limited and its partners and licensed under Oak’s terms & conditions (Collection 1), except where otherwise stated.
Loading...
3 Questions
Q1.
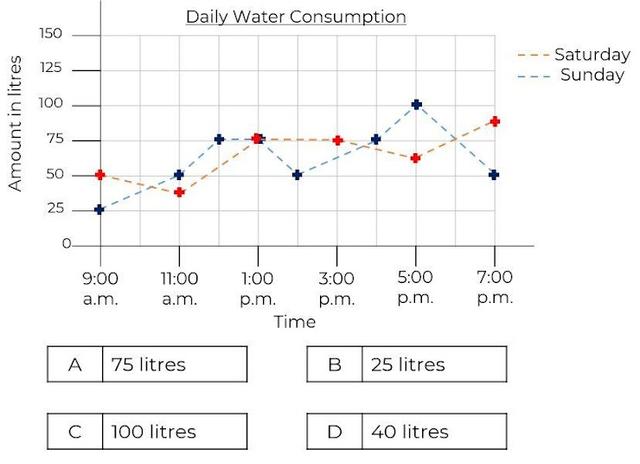
What is the range of the water used on Sunday?
B
C
D
Q2.
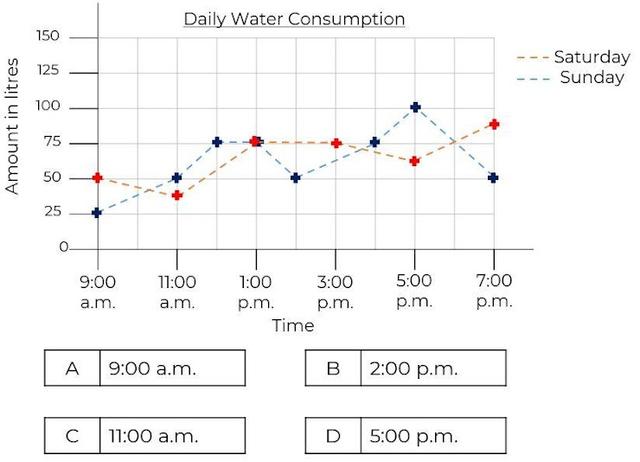
When is it most probable that the car was washed on Sunday?
A
B
C
Q3.
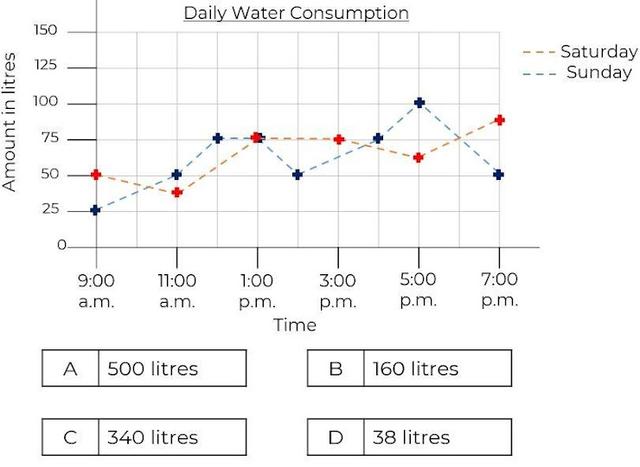
Approximately, how much more water was used on Sunday, compared with Saturday?
A
C
D
4 Questions
Q1.
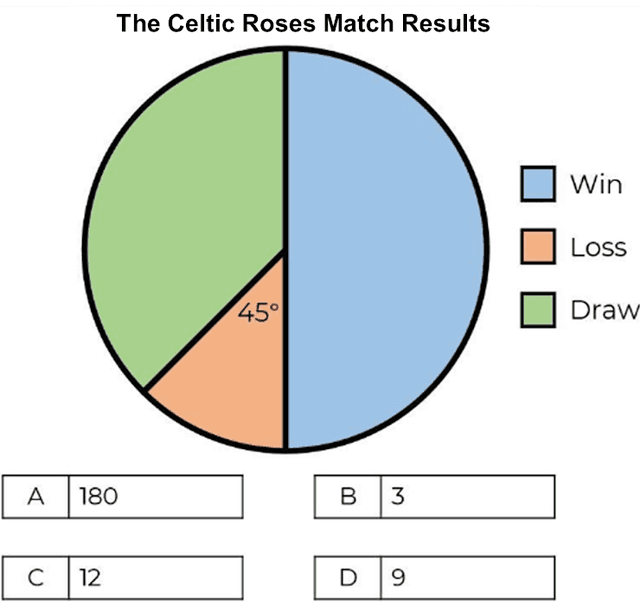
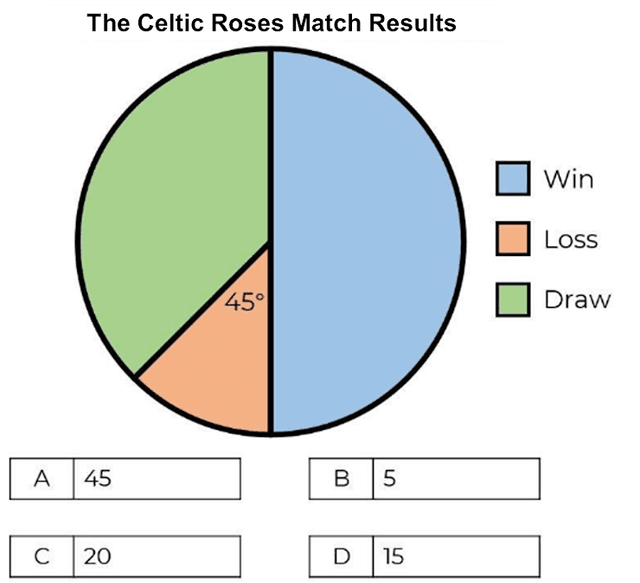
If the total matches played is 24, how many matches did the Celtic Roses win?
A
B
D
Q2.
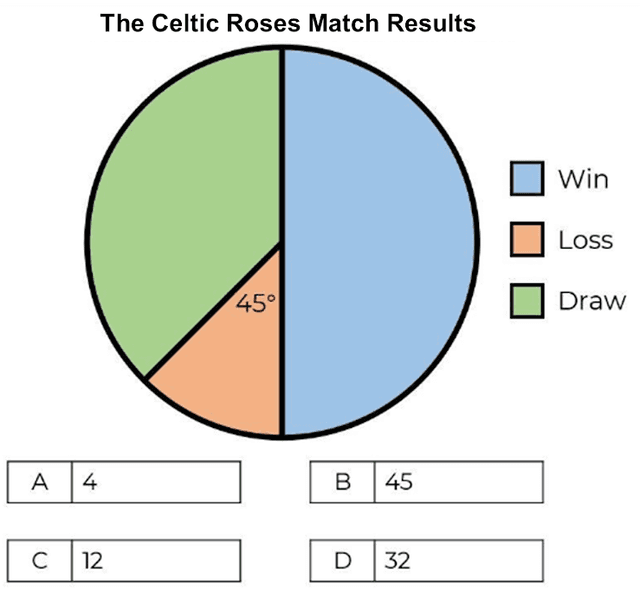
If the total matches played is 40, how many matches did the Celtic Roses lose?
A
C
D
Q3.
If the Celtic Roses win 16 matches, how many did they lose?
B
C
D
Q4.
If the Celtic Roses draw 24 matches, how many did they win?
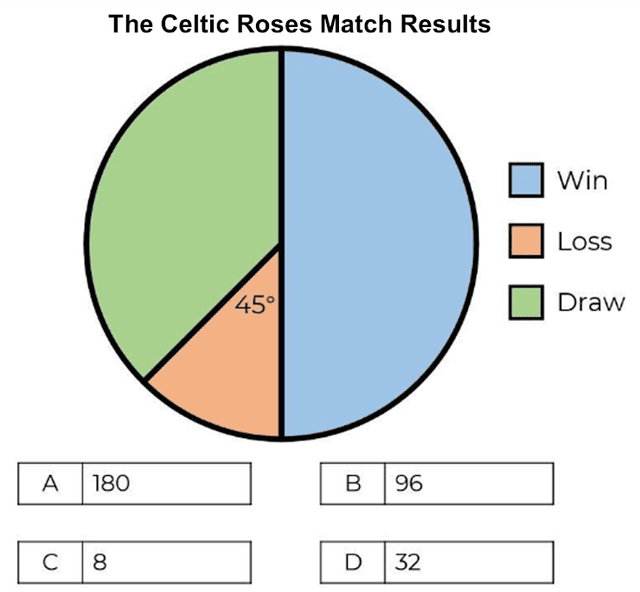
A
B
C