

Year 11
Foundation
Year 11
Foundation
Plot and interpret time-series graphs
These resources will be removed by end of Summer Term 2025.
Switch to our new teaching resources now - designed by teachers and leading subject experts, and tested in classrooms.
These resources were created for remote use during the pandemic and are not designed for classroom teaching.
Lesson details
Key learning points
- In this lesson, we will learn how to plot and interpret time-series graphs. We will model how to solve problems using these graphs.
Licence
This content is made available by Oak National Academy Limited and its partners and licensed under Oak’s terms & conditions (Collection 1), except where otherwise stated.
Loading...
4 Questions
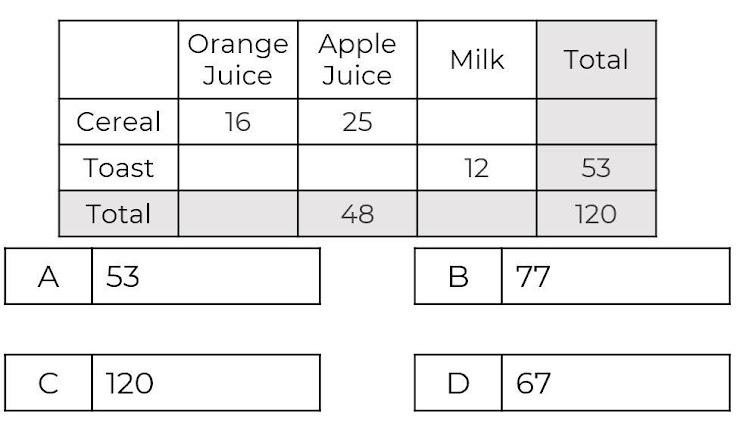
Q1.
How many people ate cereal for breakfast?
A
B
C
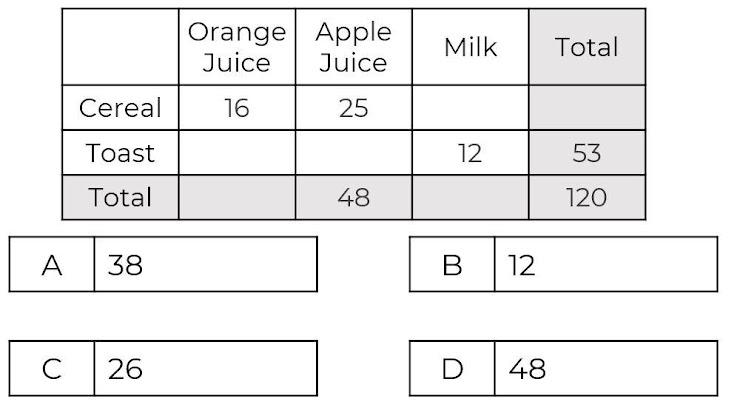
Q2.
How many people chose milk to drink?
B
C
D
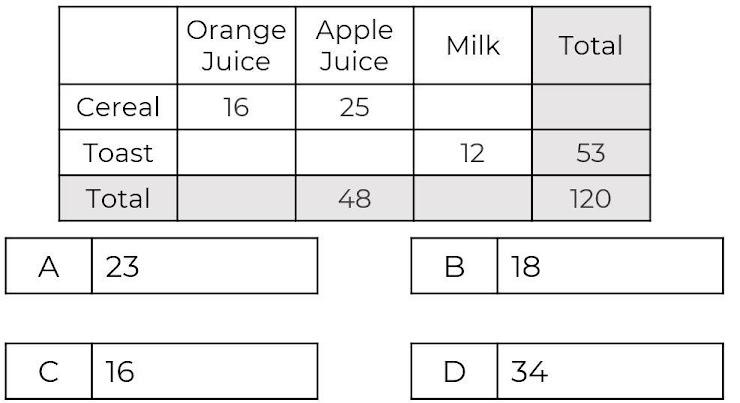
Q3.
How many people ate toast and drank orange juice?
A
C
D
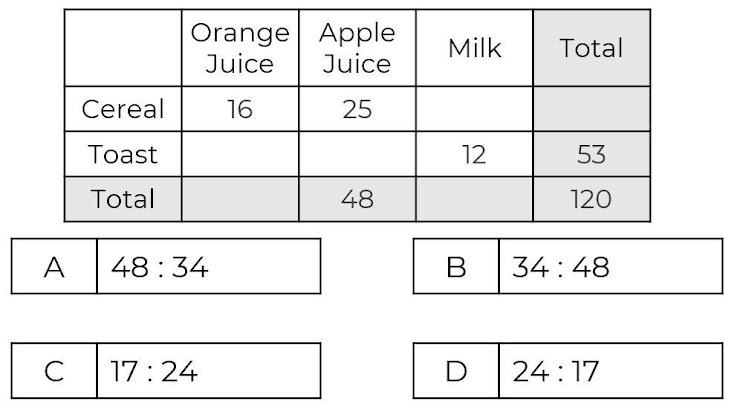
Q4.
What is the ratio of apple juice : orange juice in its simplest form?
A
B
C
3 Questions
Q1.
What is the range of the water used on Sunday?
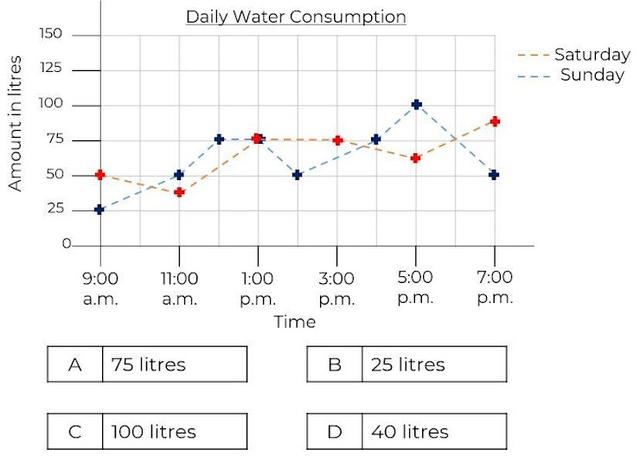
B
C
D
Q2.
When is it most probable that the car was washed on Sunday?
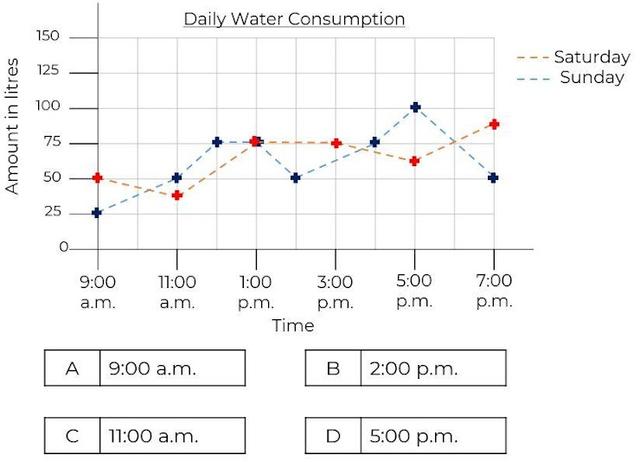
A
B
C
Q3.
Approximately, how much more water was used on Sunday, compared with Saturday?
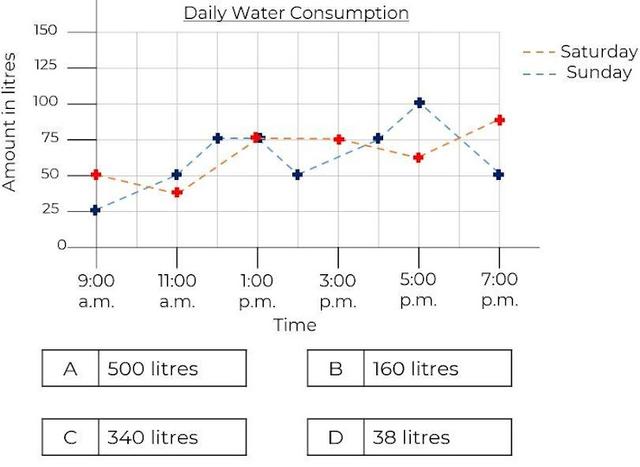
A
C
D