Choose exam board for KS4 Computer Science (GCSE)
Choose exam board for KS4 English
Choose exam board for KS4 French
Choose exam board for KS4 Geography
Choose exam board for KS4 German
Choose exam board for KS4 History
Choose tier for KS4 Maths
Choose exam board for KS4 Music
Choose exam board for KS4 Physical education (GCSE)
Choose exam board for KS4 Religious education (GCSE)
Choose exam board for KS4 Spanish

      Solve problems using bar charts, pictograms and tables
      Lesson details

      Learning outcome

      I can solve problems using scaled bar charts, pictograms and tables.

      Key learning points

      1. A key on a pictogram and the scale of a bar chart can provide key information about the data shown.
      2. Annotating pictograms and bar charts helps to solve problems.
      3. Rearrange equations to make it easier to calculate missing numbers.

      Keywords

      • Bar chart - A bar chart uses rectangular bars to show different values.

      • Pictogram - A pictogram uses pictures to show information.

      • Table - A table has information arranged in rows and columns.

      Common misconception

      Pupils may find it tricky using scales to read bar charts, especially when the scale uses multiples of five.

      Encourage pupils to think about where intermediate numbers are on bar charts (e.g. numbers from 10 to 15). They may count from one number to another or make marks to show approximately where numbers would be found.

      Teacher tip

      Pupils will become more familiar with the use of bar charts, pictograms and table in the lesson. Encourage pupils to write numbers on pictograms and bar charts. They will need to be familiar with some problem solving strategies, including how to work out the missing numbers in equations.

      Licence

      This content is © Oak National Academy Limited (2025), licensed on Open Government Licence version 3.0
      except where otherwise stated. See Oak's terms & conditions
      (Collection 2).

      Lesson video

      Loading...

      Prior knowledge starter quiz

      6 Questions

      Q1.
      Which number in this equation is the sum? 21 = 14 + 7

      7
      14
      Correct answer: 21

      Q2.
      Which number is this equation is the difference? 12 = 20 − 8

      8
      Correct answer: 12
      20

      Q3.
      Which pairs of numbers have a sum of 17?

      Correct answer: 9 and 8
      Correct answer: 7 and 10
      6 and 12
      Correct answer: 4 and 13

      Q4.
      Find the difference in the equation $$\square$$ = 24 − 6

      Correct Answer: 18, eighteen

      Q5.
      What is the sum of 8, 6 and 2?

      Correct Answer: 16, sixteen

      Q6.
      Find the missing number. $$\square$$ + 9 = 23

      Correct Answer: 14, fourteen

      6 Questions

      Q1.
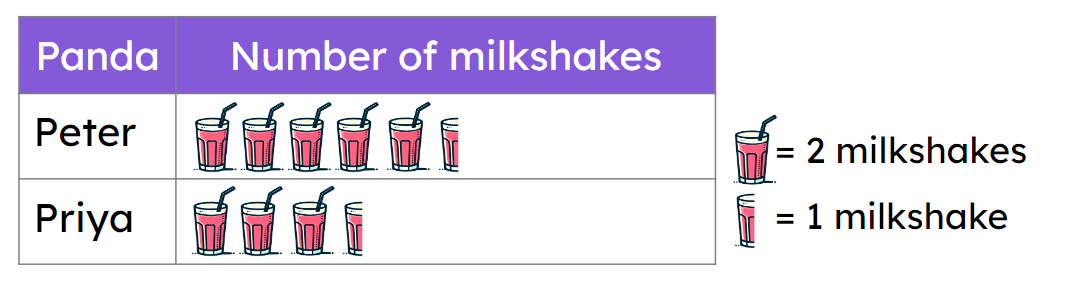
      Look at the pictogram. How many milkshakes did Peter have?

      An image in a quiz
      Correct Answer: 11, eleven

      Q2.
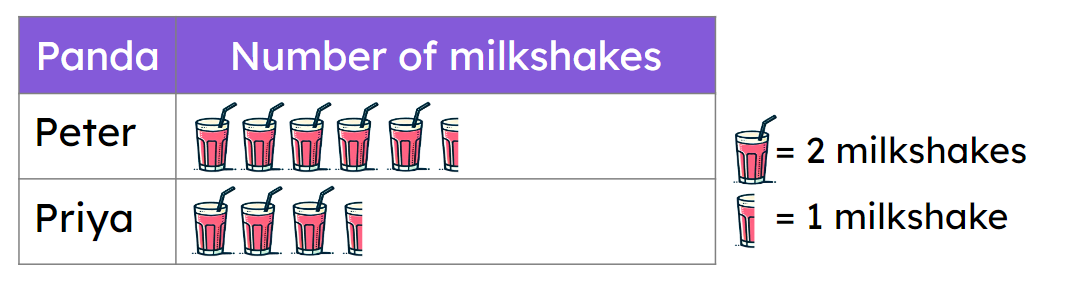
      How many milkshakes did Peter and Priya have altogether?

      An image in a quiz
      Correct Answer: 18, eighteen

      Q3.
      How many more milkshakes did Peter have than Priya?

      An image in a quiz
      Correct Answer: 4, four

      Q4.
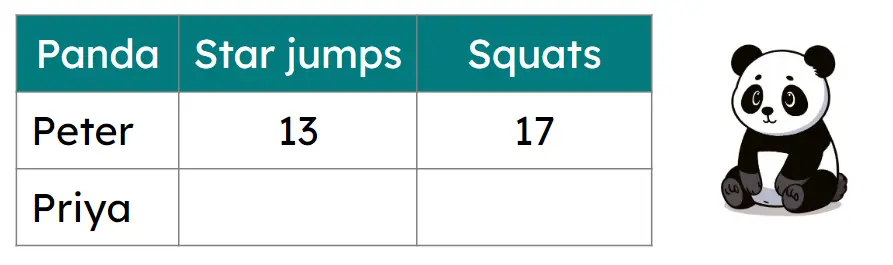
      Priya and Peter completed 20 star jumps between them during their workout. How many star jumps did Priya do?

      An image in a quiz
      Correct answer: 7
      13
      17

      Q5.
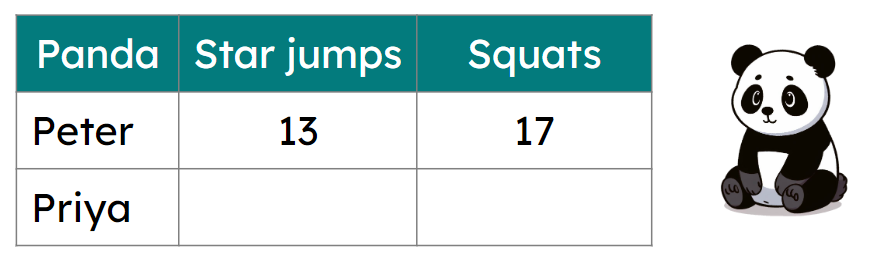
      Priya completed 8 more squats than Peter during the workout. How many squats did Priya do?

      An image in a quiz
      Correct Answer: 25, twenty-five

      Q6.
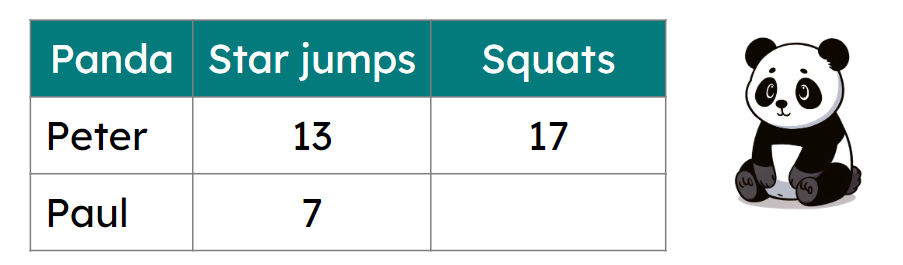
      Peter and Paul both completed the same total number of star jumps and squats. How many squats did Paul do?

      An image in a quiz
      Correct Answer: 23, twenty-three

      To help you plan your 3 maths lesson on: Solve problems using bar charts, pictograms and tables, download all teaching resources for free and adapt to suit your pupils' needs...