Agriculture and habitat loss
I can explain how growing crops for food is linked to the loss of habitats and a decrease in biodiversity.


- Year 9
Agriculture and habitat loss
I can explain how growing crops for food is linked to the loss of habitats and a decrease in biodiversity.
Lesson details
Key learning points
- Growing crops to feed animals and humans requires significant land use
- Converting land for agricultural use is one of the major causes of deforestation
- Deforestation results in habitat loss for many species
- Conversion of land for agriculture is a major cause of habitat loss and biodiversity loss
- Mitigation strategies include changing diets and positive land use change (e.g. reforestation and rewilding)
Keywords
Agriculture - using land to raise farm animals and grow crops to feed humans and farm animals
Deforestation - the removal of trees, often to use the land for agriculture or building
Habitat - the place where an organism lives, which provides the organism with food, shelter and a place to reproduce
Biodiversity - the range of different living organisms (species) in an ecosystem
Ecosystem - all the living organisms in a place interacting with each other and their non-living surroundings
Common misconception
Thinking that agriculture just means growing crops.
The lesson explores the idea that agriculture also includes using land to rear animals, and that this has destroyed more habitat than using land to grow crops.


Equipment

Licence
Lesson video
Loading...
Prior knowledge starter quiz
6 Questions
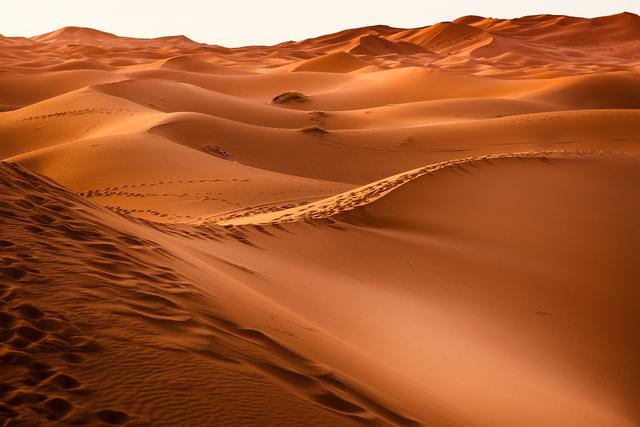
Q1.Which photograph shows a forest ecosystem?
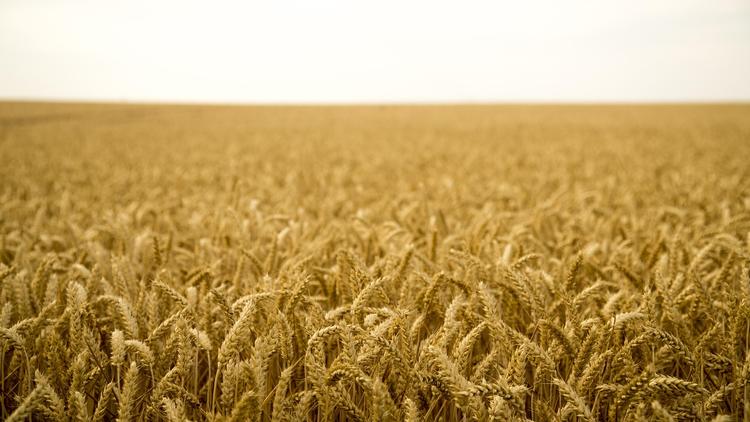
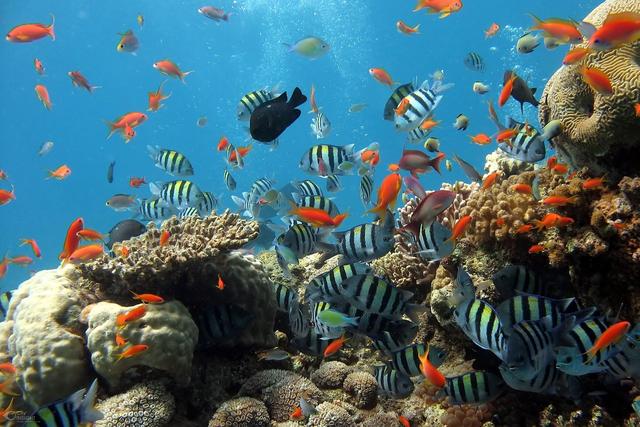
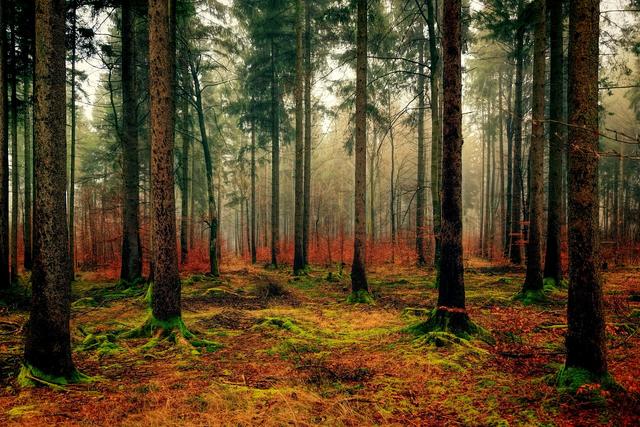
Q2.In this photograph, what is the bird?
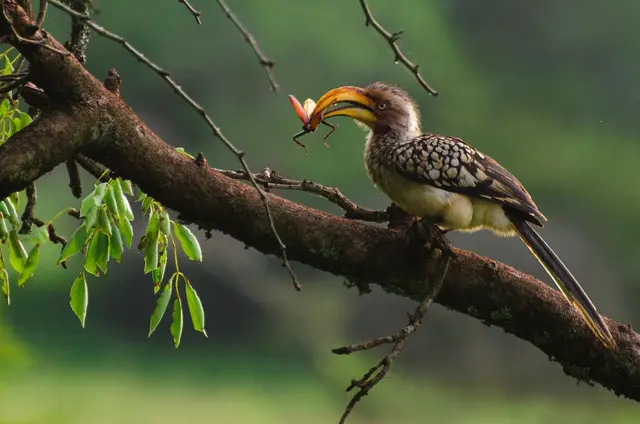
Q3.In this photograph, which organism is the prey?
Q4.In this photograph, which organism is a producer?
Q5.The place where an organism lives is called its __________.
Q6.The word means the range of different species in an ecosystem.
Assessment exit quiz
6 Questions
Q1.Match each word to its correct definition.

Q2.Which habitat is likely to have the highest biodiversity?
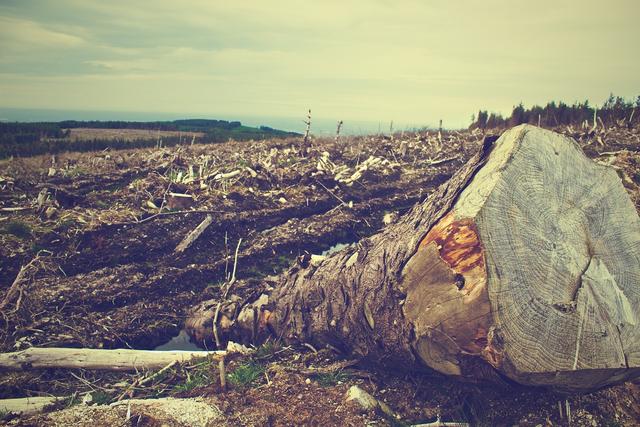
Q3.Using land to raise farm animals and grow crops is called .
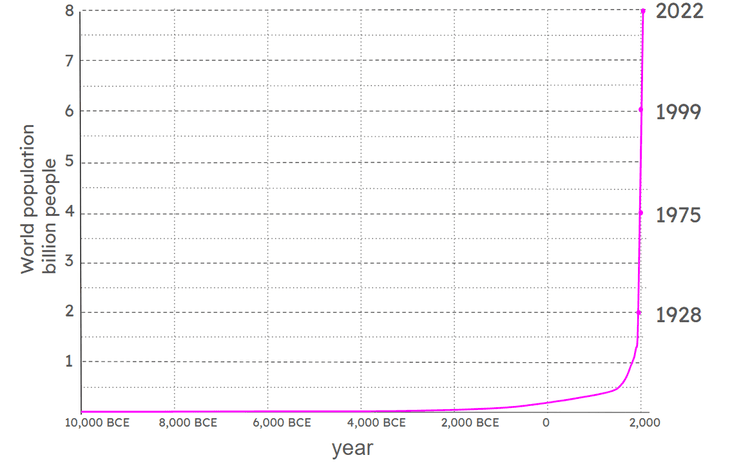
Q4.The graph shows the human population of the world over the past 12 000 years. Which conclusion can be correctly made from the graph?