New
New
Checking understanding of pictograms and bar charts
I can interpret both pictograms and bar charts.
Lesson 1 of 11
New
New
- Year 8
Checking understanding of pictograms and bar charts
I can interpret both pictograms and bar charts.
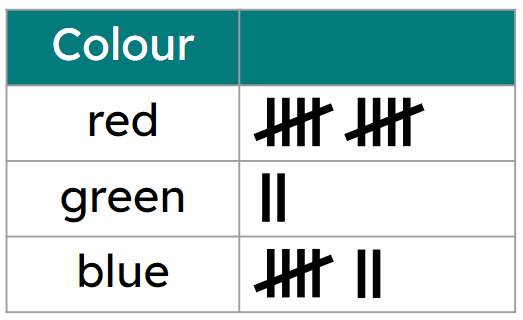
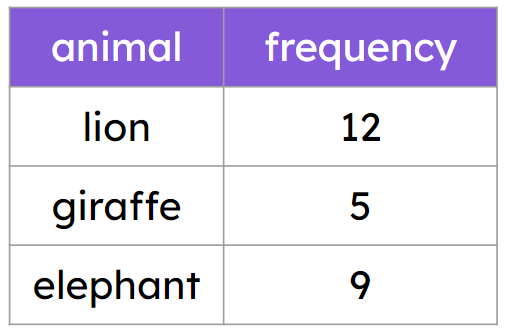
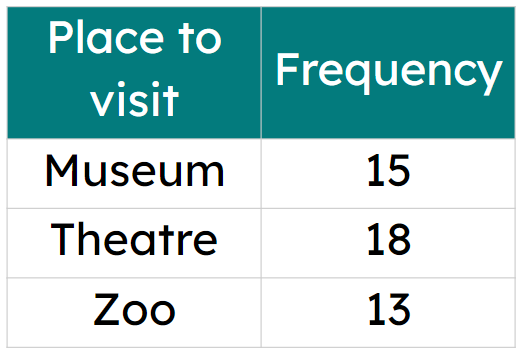
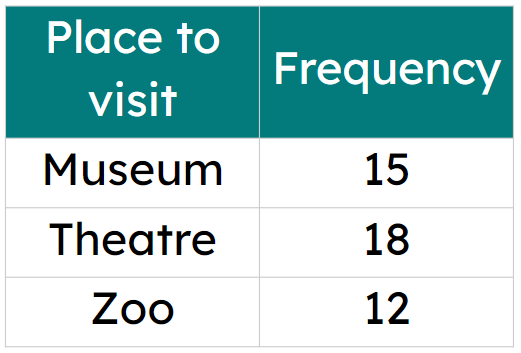
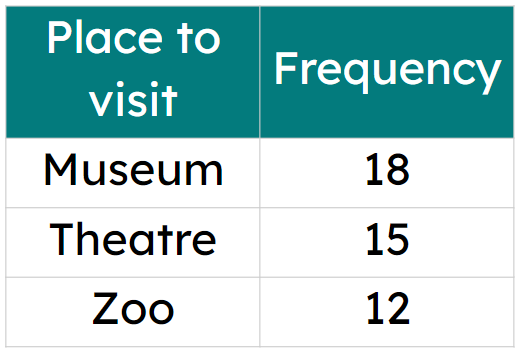
Frequency - The number of times an event occurs; or the number of individuals (people, animals etc.) with some specific property.
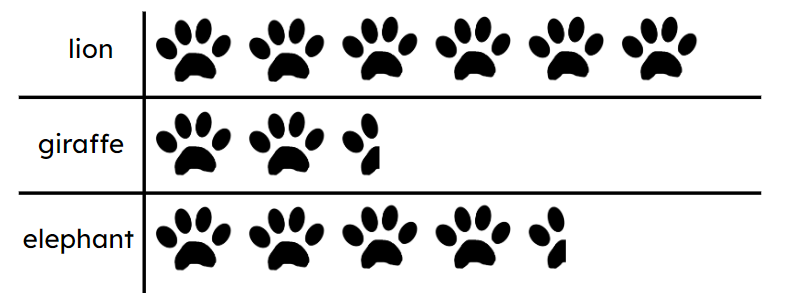
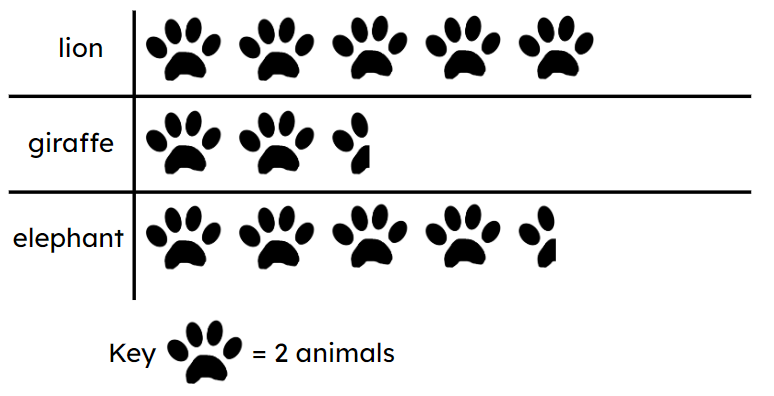
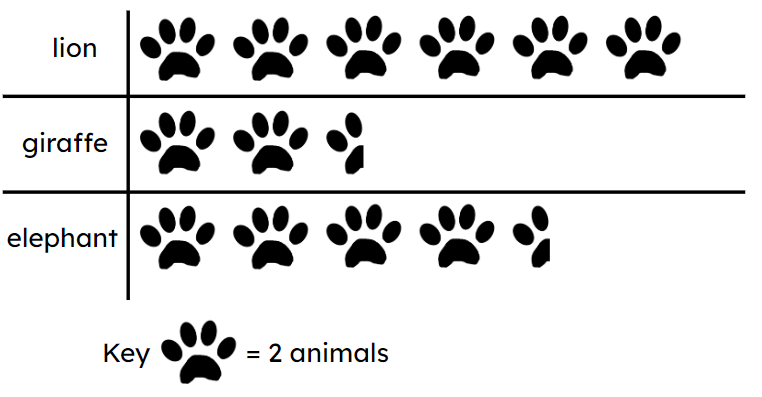
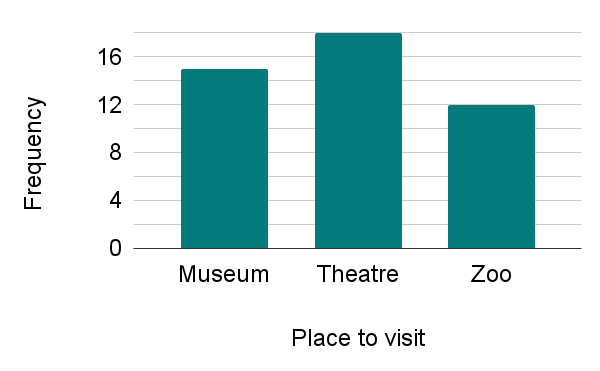
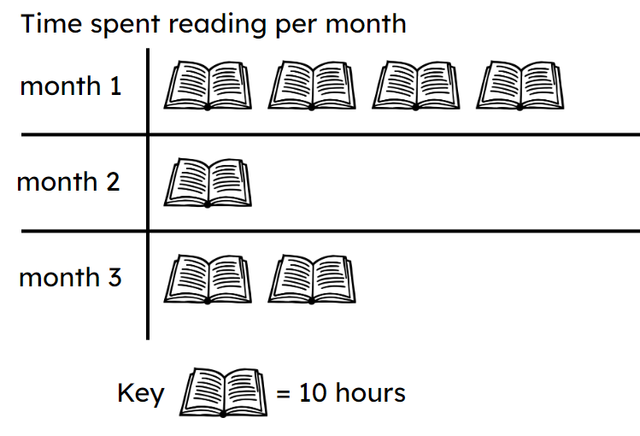
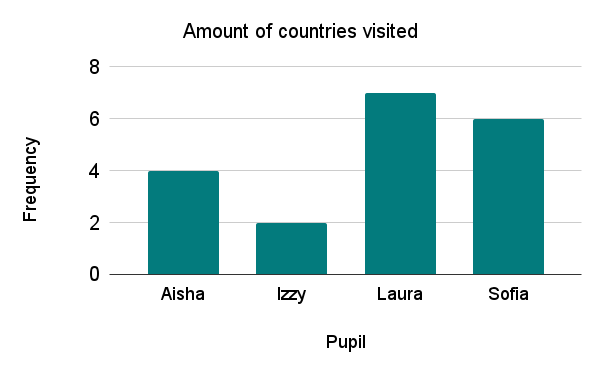
Pupils may forget the key with a pictogram or mislabel the vertical scale for bar charts.
By asking the pupils how they know there are 'x things', to highlight the need for the key.