


New
New


Lesson 4 of 11
New
New
- Year 11
Comparing box plots
I can interpret a box plot and compare two box plots.
Lesson details
Key learning points
- A box plot allows us to make conclusions about the data set
- Box plots can be compared to highlight similarities/differences in data sets
- The box part tells us about the middle 50% of the data
Keywords
Box plot - A box plot is a diagram that clearly shows the minimum and maximum value of a data set along with the three quartiles.
Median - The median is the central (middle) piece of data when the data are in numerical order. It is a measure of central tendency representing the average of the values.
Range - The range is a measure of spread. It is found by finding the difference between the highest and lowest values.
Common misconception
Not referring to the context of the question when comparing the data.
Highlight that just saying the median or the middle 50% of data is bigger is of little use unless you know what the data was about. Check that pupils understand the context of the question.
Collect data from the class, split into groups and compare the data by drawing box plots. For example, pupils could collect data on how many seconds they can hold their breath for. Alternatively, this is an opportunity to use data from other subjects, such as Geography or Science.

Teacher tip

Licence
This content is © Oak National Academy Limited (2025), licensed on Open Government Licence version 3.0 except where otherwise stated. See Oak's terms & conditions (Collection 2).
Lesson video
Loading...
Prior knowledge starter quiz
6 Questions
Q1.The vertical line inside the box of a box plot represents the .
The vertical line inside the box of a box plot represents the .

Q2.What is the height of the tallest person?
What is the height of the tallest person?

Q3.What is the lower quartile height?
What is the lower quartile height?
Q4.What is the upper quartile of this set of data? 17, 13, 19, 21, 13, 14.
What is the upper quartile of this set of data? 17, 13, 19, 21, 13, 14.
Q5.Below is the box plot for this set of data: 17, 13, 19, 21, 13, 14. What is the value of point A on the box plot?
Below is the box plot for this set of data: 17, 13, 19, 21, 13, 14. What is the value of point A on the box plot?
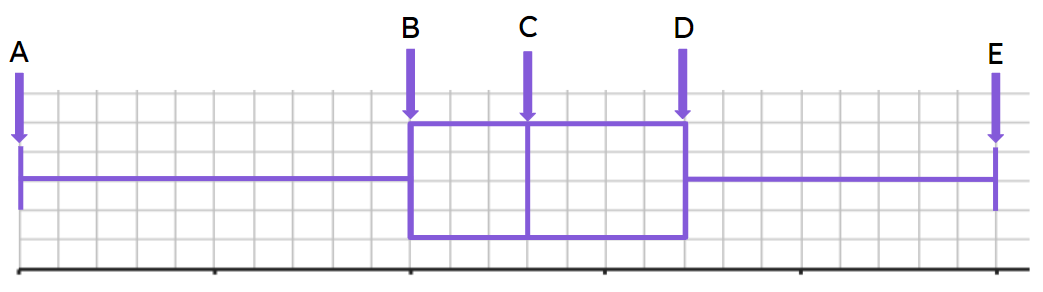
Q6.Below is the box plot for this set of data: 17, 13, 19, 21, 13, 14. What is the value of point D on the box plot?
Below is the box plot for this set of data: 17, 13, 19, 21, 13, 14. What is the value of point D on the box plot?
Assessment exit quiz
6 Questions
Q1.Anything below the __________ represents 25% of the data.
Anything below the __________ represents 25% of the data.
lowest value
median
upper quartile
highest value
Q2.Anything below the upper quartile represents what percentage of the data?
Anything below the upper quartile represents what percentage of the data?
Q3.What is the range of the middle 50% of data?
What is the range of the middle 50% of data?
Q4.A box indicates data that is more consistent.
A box indicates data that is more consistent.
Q5.Which class did better on average?
Which class did better on average?
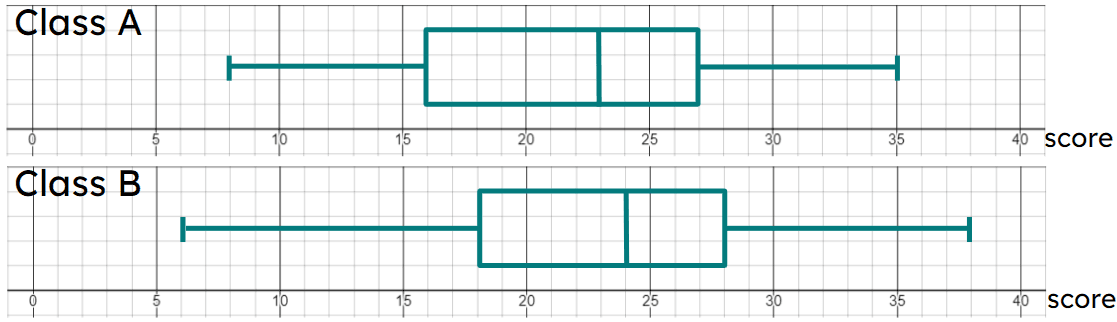
Q6.Which class has more consistent scores?
Which class has more consistent scores?
