


New
New


Lesson details
Lesson video
Loading...

Box plot - A box plot is a diagram that clearly shows the minimum and maximum value of a data set along with the three quartiles.
Forgetting to order the list of data before finding the 5 key pieces of information.
Ask some pupils to stand at the front of the classroom. Find the person in the middle, and pose the question "is they the median sized person?" Repeat with quartiles. This should highlight the importance of putting the numbers in order first.


Loading...

Lower quartile - $$Q_1$$
Median - $$Q_2$$
Upper quartile - $$Q_3$$


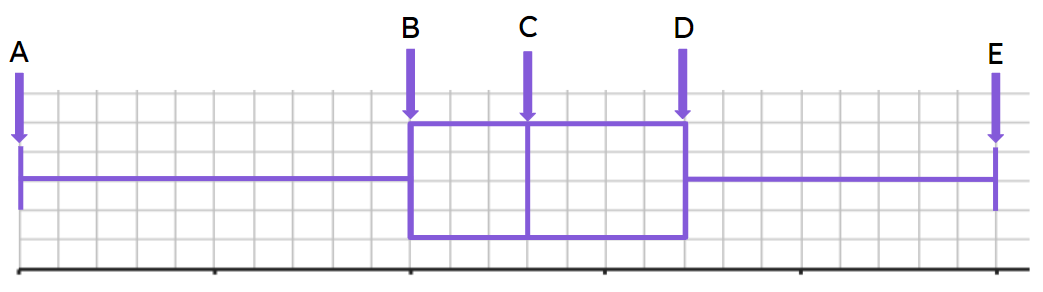
A - Lowest value
B - Lower quartile
C - Median
D - Upper quartile
E - Highest value

