


Constructing pie charts by utilising technology
I can construct pie charts from data presented in a number of different ways using technology.


- Year 8
Constructing pie charts by utilising technology
I can construct pie charts from data presented in a number of different ways using technology.
Lesson details
Key learning points
- Pie charts can be constructed quickly using Excel.
- The angle of each part can be quickly calculated in Excel.
- Different types of pie chart can be created.
Keywords
Clockwise - Clockwise is the direction that the hands of an analogue clock travel
Pie chart - A pie chart (pie graph) is a circular graph where sectors represent different groups proportionally.
Frequency - The frequency is the number of times an event occurs; or the number of individuals (people, animals etc.) with some specific property.
Angle - An angle is a measure of turn, it is often displayed as the rotation between two line segments.
Sector - A sector is the region formed between two radii and their connecting arc.
Common misconception
1) = not necessary to put into function, 2) students type in number to calculate, not click the cell
1) the = at the start tells the spreadsheet to start a calculation, 2) clicking the cell means if input data chances, outputs auto-update


Licence
Lesson video
Loading...
Prior knowledge starter quiz
6 Questions
Q1.60 people were asked: "what do you most frequently drink whilst at work". The results will be placed in a pie chart with a total of 12 pre-defined sectors. How many sectors would represent water?
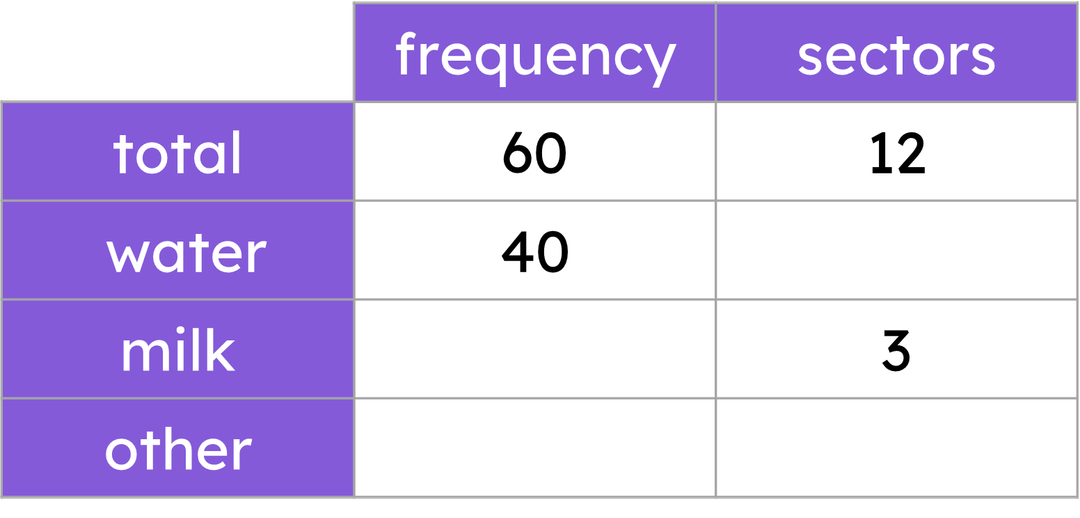

Q2.60 people were asked: "what do you most frequently drink whilst at work". The results will be placed in a pie chart with a total of 12 pre-defined sectors. How many people voted for milk?
Q3.A large set of information is collected and represented in a pie chart of 24 equally-sized sectors. Each one sector represents a frequency of 15. What is the total frequency of this dataset?
Q4.The incomplete ratio table shows a dataset being converted into angles to represent each subgroup as sectors on a pie chart. Match the letters to the correct missing values.
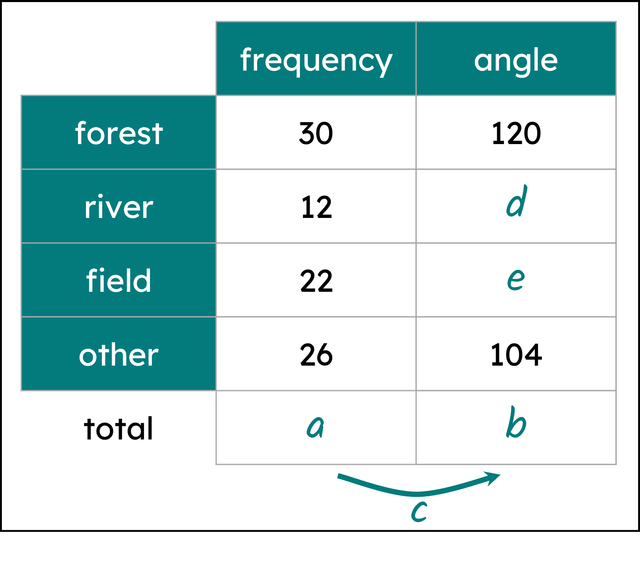
a - 90
b - 360
c - 4
d - 48
e - 88
Q5.Which of these parts of a circle are essential when forming one sector of a circle?
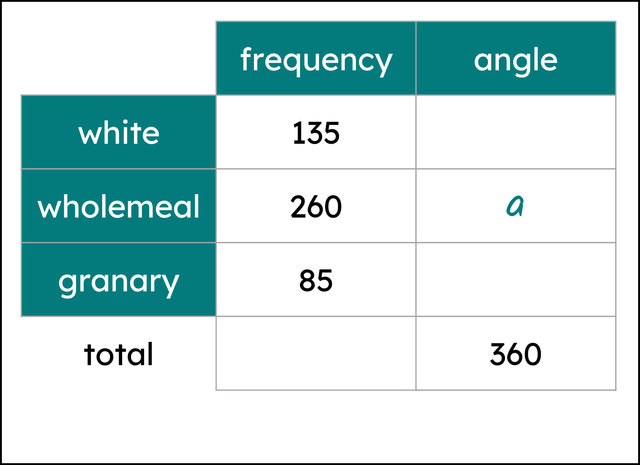
Q6.The incomplete ratio table shows a dataset being converted into angles to represent each subgroup as sectors on a pie chart. Find the value of angle a, in degrees.
Assessment exit quiz
6 Questions
Q1.Which symbol must be typed into a cell first in order to start any mathematical calculation?
Q2.Match the mathematical operation to the symbol used to represent these operations in a spreadsheet
addition - +
subtraction - -
multiplication - *
division - /
not used for any operation - x
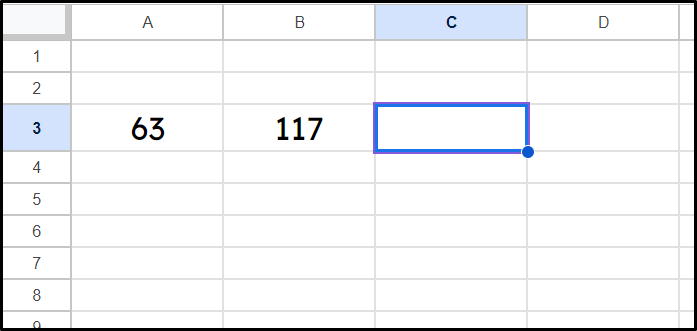
Q3.Which of these spreadsheet functions will correctly calculate 63 add 117 in the cell C3?
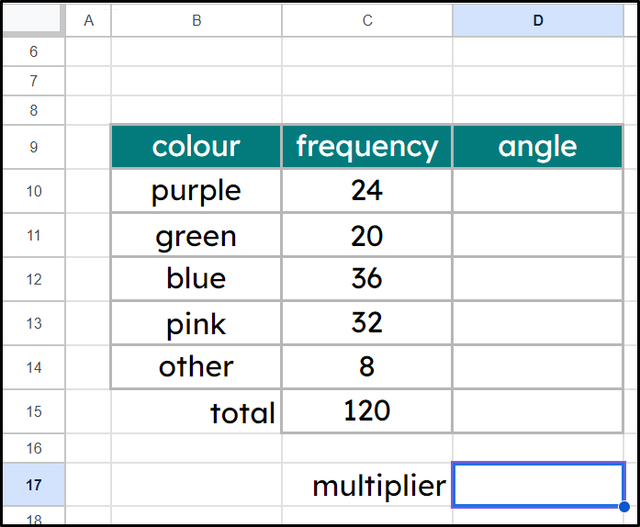
Q4.Select the spreadsheet function and answer which correctly show the multiplier being calculated for this ratio table in the cell D17.
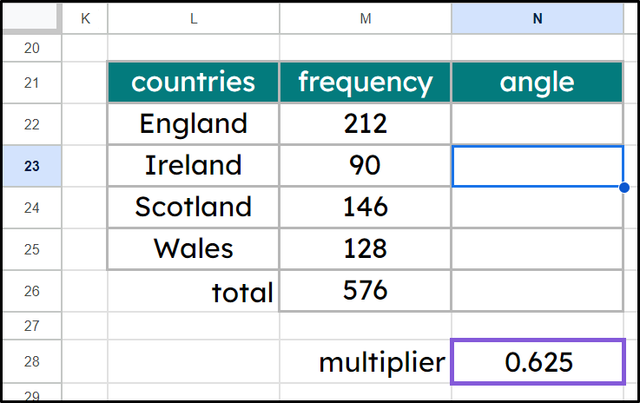
Q5.Select the spreadsheet function and answer which correctly shows and updates the angle for Ireland, calculated in the cell N23. The values in the frequency column may be updated.
Q6.Match the descriptions with the correct spreadsheet functions and output values for this ratio table written in a spreadsheet.
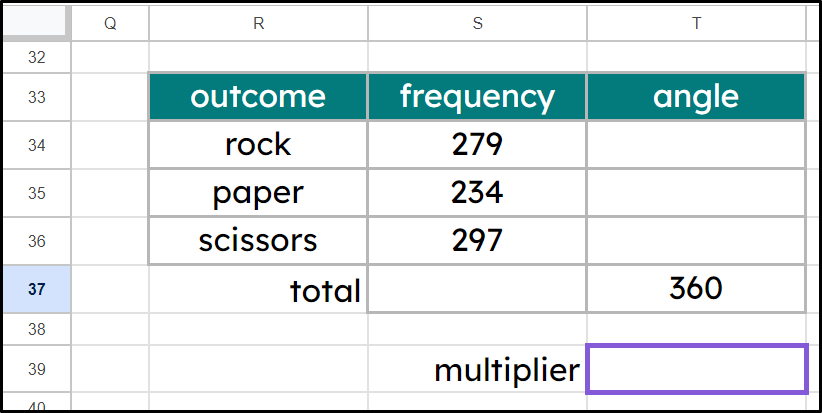
Spreadsheet function for S37 - = sum(S34 : S36)
Output value for S37 - 810
Spreadsheet function for T39 - = 360 / S37
Output value for T39 - $$4\over9$$ or $$0.44\dot4$$
Spreadsheet function for T34 - = S34 * T39
Output value for S34 - 124
