


Continuous variation: data handling and analysis
I can plot data on continuous variation on a histogram and suggest possible causes for the variation.


- Year 8
Continuous variation: data handling and analysis
I can plot data on continuous variation on a histogram and suggest possible causes for the variation.
Lesson details
Key learning points
- Using a histogram or line graph to display continuous data.
- Plotting data for continuous variation on a histogram.
- Interpreting and describing a histogram displaying data for continuous variation.
- Continuous variation is usually influenced by many factors, including genetics, the environment and lifestyle.
Keywords
Continuous variation - Variation which can take any one of many values over a continuous range.
Line graph - A graph displaying continuous data plotted as points joined with a line.
Histogram - A graph displaying continuous data grouped into ranges and plotted as columns that touch.
Environment - Factors in an organism’s surroundings that influence its features.
Genetic - Related to the genetic material (DNA) and genes that an individual has.
Common misconception
Using a bar chart to plot continuous data. Features with continuous variation are only due to genetic factors.
The lesson explores why a histogram or line graph is the correct choice for plotting discontinuous data, and the idea that continuous variation is usually influenced by many factors, including genetics, the environment and lifestyle.


Equipment

Licence
Lesson video
Loading...
Prior knowledge starter quiz
6 Questions
Q1.Which two pieces of equipment should you use when drawing a graph?




Q2.How many students in this class can only roll their tongue into a straw shape?
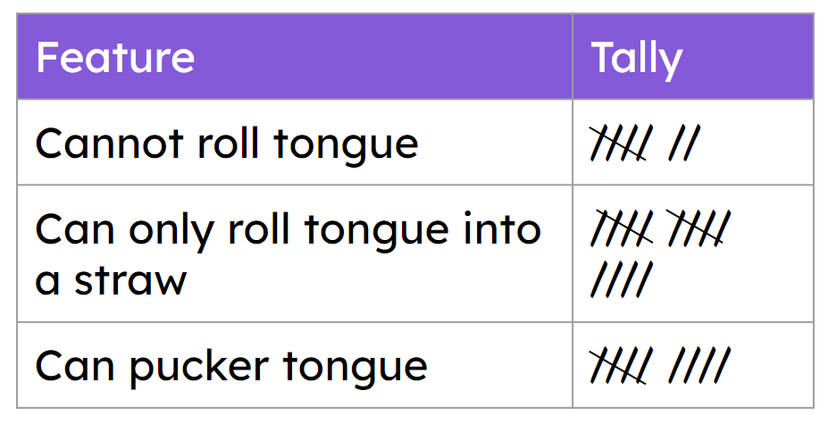
Q3.How many students in this class cannot roll their tongue?
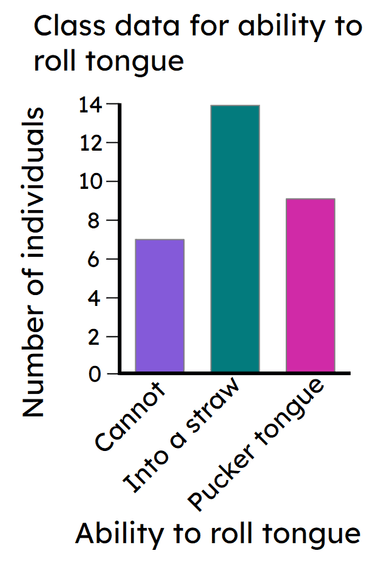
Q4.The peas produced by pea plants can either be smooth or wrinkled. This is an example of variation.
Q5.Data for discontinuous variation should always be plotted on a ...
Q6.Which two of the statements below are conclusions that could be drawn from the data in the bar chart?
Assessment exit quiz
6 Questions
Q1.How many students have a height that is in the range of 160 to 169 cm?
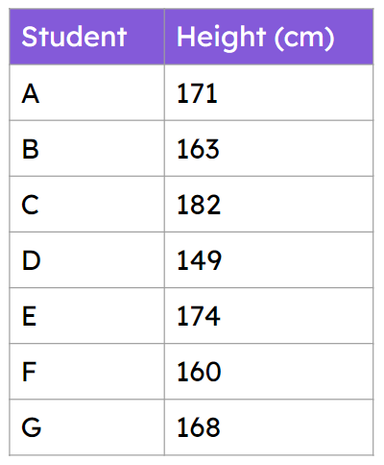
Q2.Which type of graph has this data been displayed in?
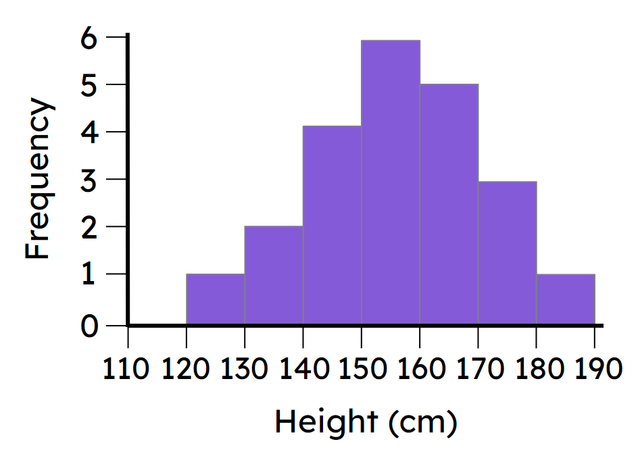
Q3.Height is an example of variation.
Q4.Match each type of graph to its correct feature.

Q5.Which of the following conclusions could be drawn from the histgram shown?
