


Explain how the mean changes when the total quantity or number of values changes
I can explain how the mean changes when the total quantity or number of values changes


- Year 6
Explain how the mean changes when the total quantity or number of values changes
I can explain how the mean changes when the total quantity or number of values changes
Lesson details
Key learning points
- When the total value of the set increases, the mean average increases.
- When the total value of the set decreases, the mean average decreases.
- When the number of values changes, the total quantity must be divided by the new number of values.
Keywords
Mean average - The mean average is a single number expressing the typical value in a set of data. It is calculated by finding the total of the set of data and dividing by how many values there are.
Set of data - A set of data is a collection of facts, such as numbers, words, measurements, observations or even just descriptions of things.
Common misconception
Not realising that if you change the number of values in the set, you must divide the total by the new number of values and that this affects the value of the mean average.
Use the definition of the mean average to check that the total of the set of data is correctly calculated and that the number of values in the set of data is correctly identified in all examples and contexts.


Licence
Lesson video
Loading...
Prior knowledge starter quiz
6 Questions
Q1.What is the difference between 12 and 15?
Q2.24 ÷ 6 =
Q3.Match the equation to the answer.

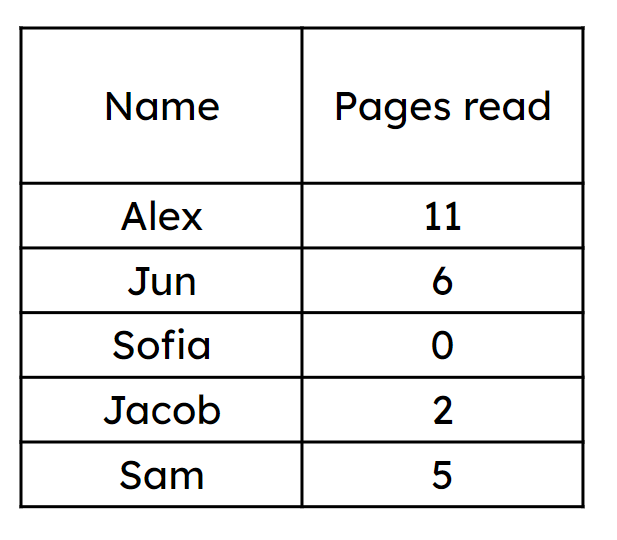
Q4.The data shows the number of pages read by four children. What is the mean average number of pages? Jun: 6; Sam: 5; Alex: 11; Jacob: 2
Q5.The data shows the number of pages read by four children. What is the mean average number of pages? Jun: 9; Sam: 0; Alex: 12; Jacob: 5
Q6.Lucas says: 'Sofia didn’t read anything so we can find the average pages read for all of us without her data.’ Is he correct?
Assessment exit quiz
6 Questions
Q1.What is the missing mean average in the table? Can you reason about the missing value without doing the calculations again?
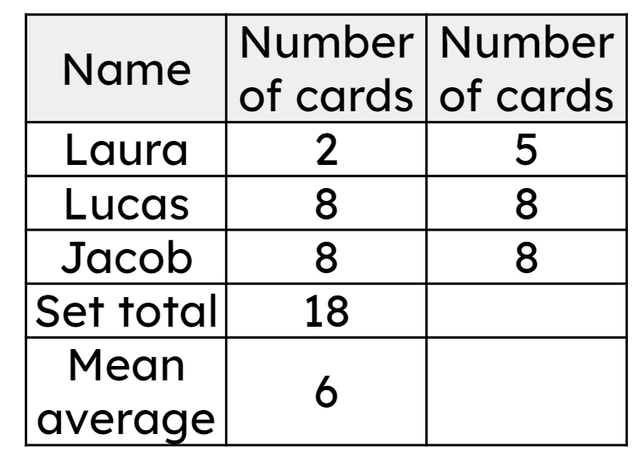
Q2.The table shows the number of cards each child currently has, the current total and mean average. Work out the mean average if Lucas gave one of his cards to Jun.
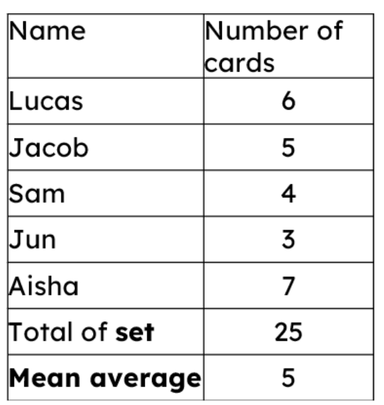
Q3.The table shows the number of cards each child currently has, the current total and mean average. Work out the mean average if Aisha loses 5 of her cards.
Q4.The table shows the number of cards each child currently has, the current total and mean average. Work out the mean average if Lucas gains an extra 10 cards.
