Explain how to use the mean to make comparisons between two sets of data
I can explain how to use the mean to make comparisons between two sets of information


- Year 6
Explain how to use the mean to make comparisons between two sets of data
I can explain how to use the mean to make comparisons between two sets of information
Lesson details
Key learning points
- The mean value can be used to compare two different sets of data.
- The mean is a single value which can represent a set of data.
Keywords
Mean average - The mean average is a single number expressing the typical value in a set of data. It is calculated by finding the total of the set of data and dividing by how many values there are.
Set of data - A set of data is collection of facts, such as numbers, words, measurements, observations or even just descriptions of things.
Common misconception
The mean average is used to compare different sets of data. Much of the data we see in the media uses mean average values so it is important to know how these figures are calculated.
Discuss what the mean average of a set of data represents and perhaps look at current news stories or local papers for examples of the mean average used in the media.


Licence
Lesson video
Loading...
Prior knowledge starter quiz
6 Questions
Q1.The difference between 9 and 15 is

Q2.56 ÷ 7 =
Q3.What is the mean average number of cards using the following data. Jun: 9; Sam: 12; Alex: 11; Jacob: 0
Q4.Four children are playing a card game. What total number of cards could the children have so that the mean average would be a whole number?
Q5.The table shows the number of cards each child currently has, the current total and mean average. Work out the mean average if Laura loses 4 of her cards.
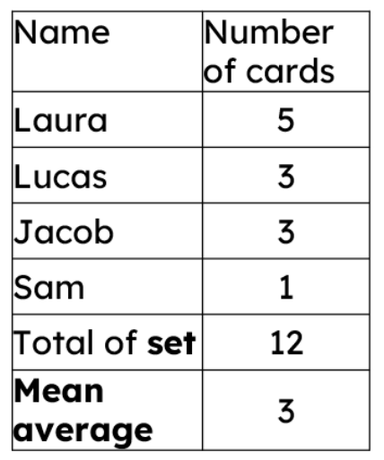
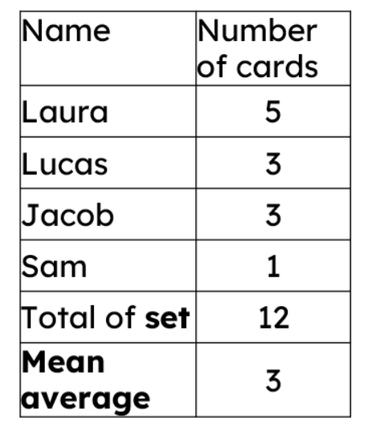
Q6.The table shows the number of cards each child currently has, the current total and mean average. Work out the mean average if the teacher gives the children 8 extra cards.
Assessment exit quiz
6 Questions
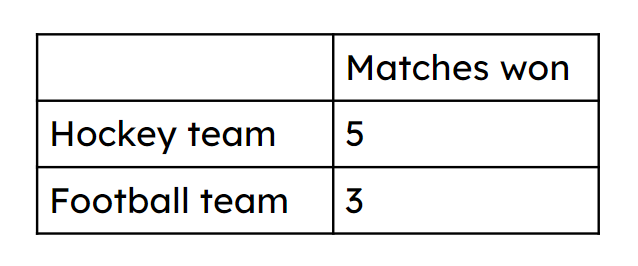
Q1.Lucas says that the hockey team are the most successful as they have won more matches. Why can we not tell if this is true?
Q2.Lucas and Laura compare the data of the Oak hockey and netball team. They have played an equal amount of matches. Which team is most successful?
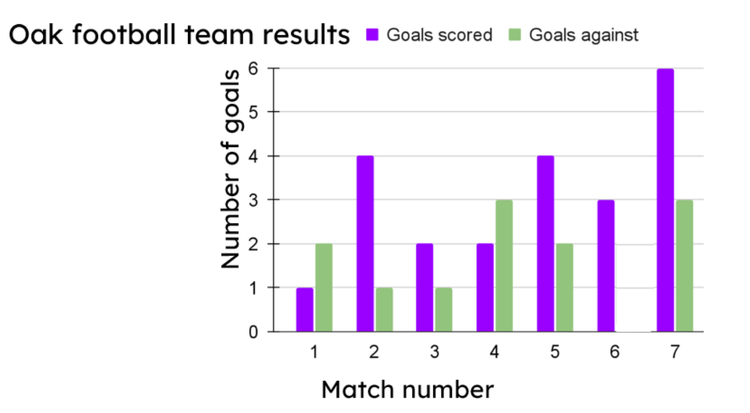
Q3.Look at the graph. What is the mean average amount of goals scored by the hockey team during each match?
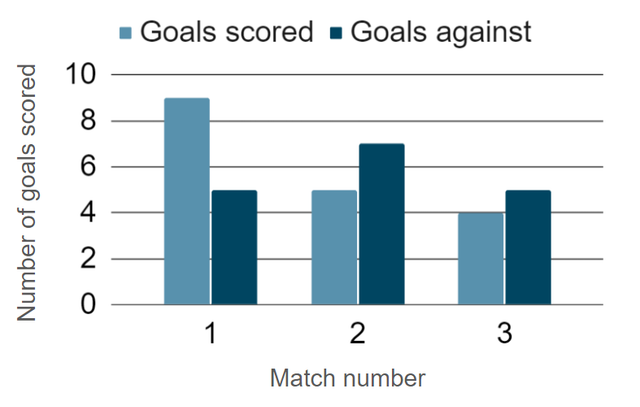
Q4. Laura compares the Oak hockey team to Willow hockey team. Oak played 9 games and scored a total of 81 goals. Willow played 10 games and scored 84 goals. Which school team is more successful?
Q5.The score for match 4 for the netball team was wrong and has been removed from the graph. The mean average goals scored is 5 What must the missing value be for goals scored?
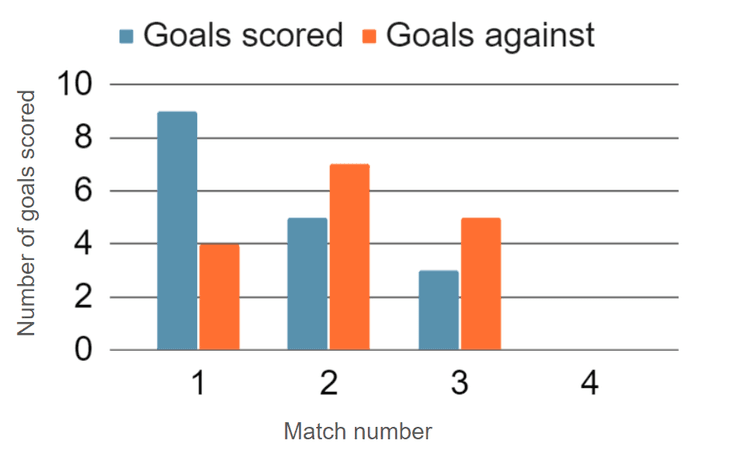
Q6.Calculate the mean average difference in the goals scored and goals against for the Oak football team. The mean average is