Heating and cooling curves
I can explain the shape of a heating/cooling curve by describing the energy changes through the heating/cooling of a substance.


- Year 10
- Edexcel
Heating and cooling curves
I can explain the shape of a heating/cooling curve by describing the energy changes through the heating/cooling of a substance.
Lesson details
Key learning points
- An experiment can be planned to measure the temperature change through continuous heating of a substance
- Energy is needed to overcome forces of attraction between particles so temperature does not change when changing state
- The change in state of pure substances can be seen on a heating/cooling curve as a horizontal line
- There is a change of energy, arrangement, and organisation of particles of a pure substance at each stage
Keywords
Heating curve - shows temperature changes of a substance over time as it is heated.
Cooling curve - shows temperature changes of a substance over time as it is cooled.
Intermolecular forces - are forces between particles.
Common misconception
Pupils struggle to understand what is taking place at the horizontal parts of the graph.
Be concise with your language and ask pupils to use the same language. 'have enough energy to overcome the forces of attraction between particles', 'to slide past each other', 'to move past each other'.


Licence
Lesson video
Loading...
Prior knowledge starter quiz
6 Questions
Q1.Sort the states of matter and the temperatures at which changes of state occur into the correct order, starting with a substance in the solid state.
Q2.Freezing and condensing are exothermic processes. Melting, evaporation and boiling are processes.
Q3.A block of pure ice is heated in a beaker until it has all melted. Which of the following statements are correct?
Q4.Match the following keywords to their definition.

Q5.Which of the following statements describe what happens when a pure substance boils and changes from the liquid state to the gas state?
Q6.Which of the following statements describes what happens when a pure substance freezes and changes from the liquid state to the solid state?
Assessment exit quiz
6 Questions
Q1.Consider a heating curve (see image). The following statements are about some of the sections (e.g. ‘CD’ means the sloping part from C to D). Which of the statements are correct?

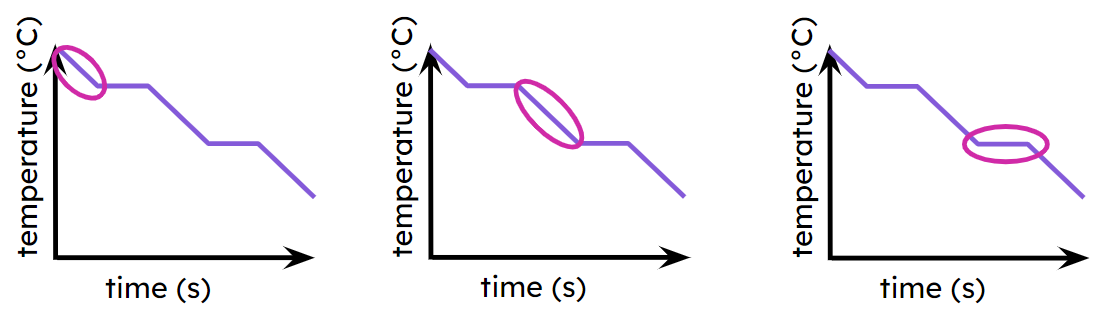
Q2.The image shows three cooling curves. What do the ringed sections represent, in order from left to right?
Q3.Sort the following stages of a heating curve into the correct order, starting from a statement about the solid substance:
Q4.In a heating curve experiment, the dependent variable is temperature, and the independent variable is .
Q5.Which of the following pieces of equipment would you use to measure the dependent variable in the heating curve experiment?
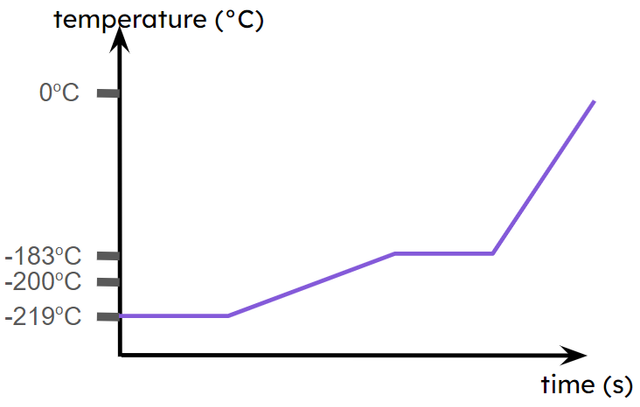
Q6.The image shows a curve for oxygen. This is a , although it starts at the melting point rather than with the substance in the solid state.