


- Year 11
Histograms with equal bar width
I can construct bar charts for continuous data.
Lesson details
Key learning points
- A histogram is a bar chart for continuous data
- The bars are adjacent due to the nature of the data
- The bars are all the same width to allow easier comparisons
Keywords
Histogram - A histogram is a diagram consisting of rectangles whose area is proportional to the frequency in each class and whose width is equal to the class interval.
Common misconception
Histograms with unequal bar widths are plotted against the frequency and/or pupils read the frequency density as the frequency of the class width.
Show what a histogram with unequal bar widths looks like when plotted against frequency. This visual aid will show pupils the distribution of data is difficult to see.


Licence
Lesson video
Loading...
Prior knowledge starter quiz
6 Questions
Q1.The of the box on a box plot represents the interquartile range.

Q2.What is the interquartile range of the data represented on this box plot?

Q3.Calculate the interquartile range from this cumulative frequency graph.
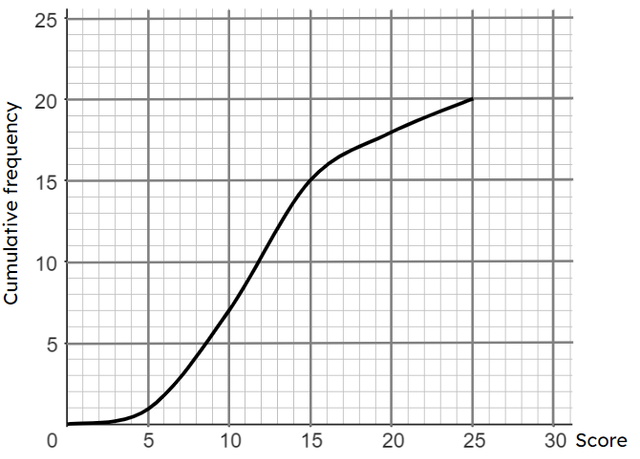
Q4.What is the interquartile range of this set of data? 17, 13, 19, 21, 13, 14, 19.
Q5.This table shows information about the heights of some year 7 and 11 pupils. Compare their heights by selecting the most useful response.
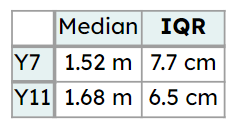
Q6.This table shows information about the times some children and adults take to complete a puzzle. Compare their times by selecting the most useful response.
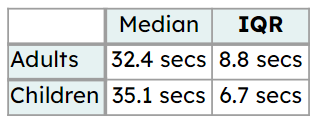
Assessment exit quiz
6 Questions
Q1.Select the examples of continuous data.
Q2.When constructing a histogram with equal bar widths, select which of the following are important points to remember.
Q3.Here is a table showing how long people watched TV for in a week. Select the correct statements which match this table.
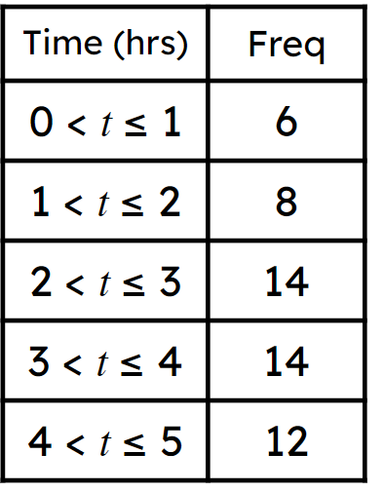
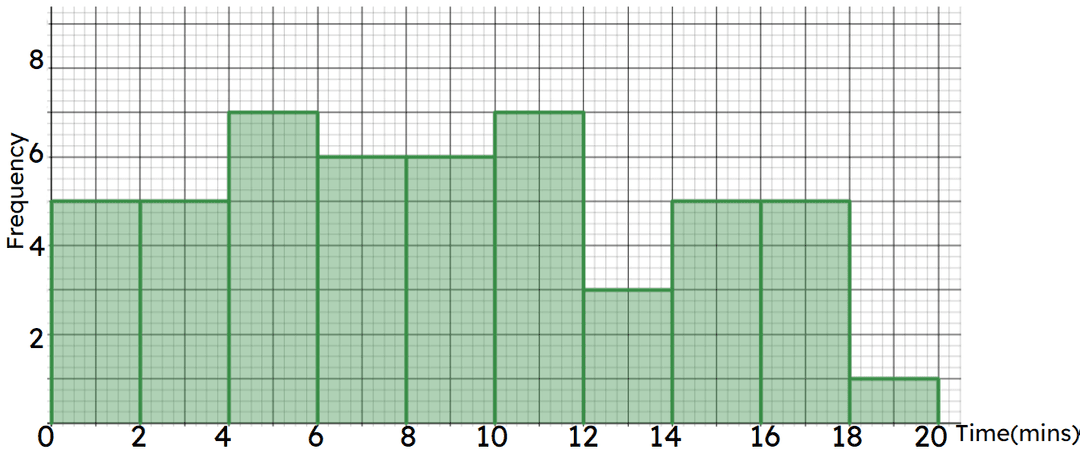
Q4.Here is a histogram showing times taken to complete an IQ test. Select the correct statements which match this chart.
Q5.Here is a histogram showing the times people played a game until they first lost a life. What percentage of people played for 20 seconds or fewer?
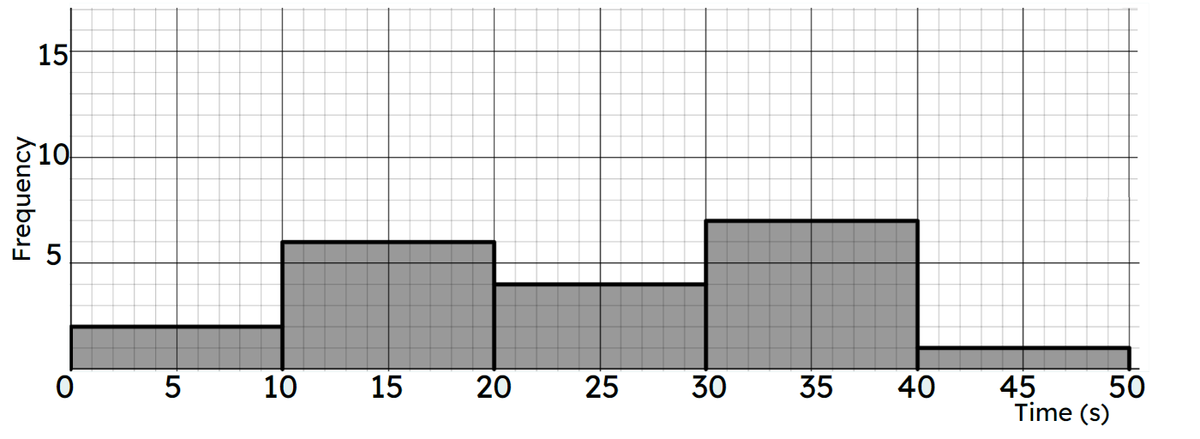
Q6.Here is a histogram showing the times people played a game until they first lost a life.
20 - Total number of people who took part
2 - Number of people who lost a life within 10 seconds of starting
8 - Number of people who played for more than half a minute
19 - The number of people who lost a life within 40 seconds of starting
95 - Percentage of people who lost a life within 40 seconds of playing
