New
New


Lesson 2 of 11
New
New
- Year 11
Interpreting a cumulative frequency graph
I can interpret a cumulative frequency graph.
Lesson details
Lesson video
Loading...

I can interpret a cumulative frequency graph.
Percentile - A percentile is a value on a scale of 100 that indicates the percent of a distribution that is equal to or below it.
Lower quartile - The lower quartile is the value under which 25% of data points are found when they are arranged in increasing order. Also known as the first quartile (Q1).
Upper quartile - The upper quartile is the value under which 75% of data points are found when they are arranged in increasing order. Also known as the third quartile (Q3).
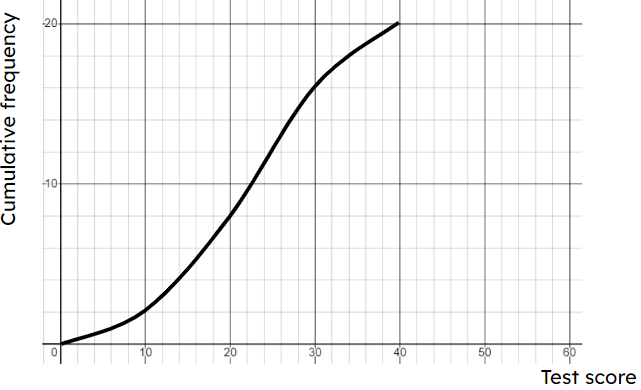
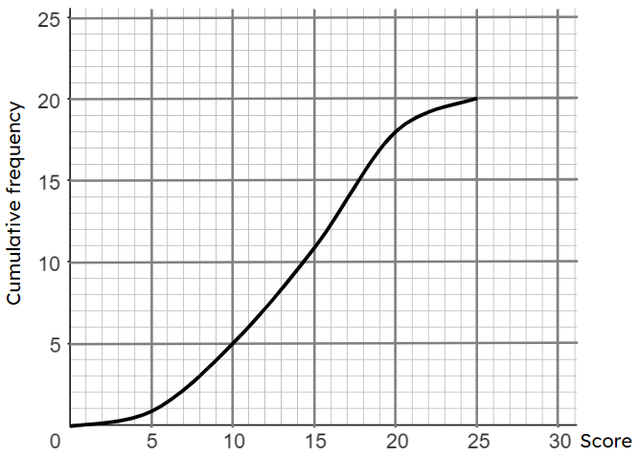
Using the highest value on the y-axis rather than the total frequency when calculating the values to read off for the lower quartile, median and upper quartile.
Ensure pupils understand that the total frequency must be used. A graph where the y-axis goes up to 100 and the total frequency is 40 can be used to highlight this. Then repeat with the same data, but with a graph where the y-axis goes up to 200.


Loading...