


New
New


Lesson details
Key learning points
- Some graphs are drawn to mislead.
- Some graphs are drawn accurately, but interpreted incorrectly.
- Unfamiliar graphs need to be carefully checked to understand what they show.
Keywords
Pie chart - A pie chart (pie graph) is a circular graph where sectors represent different groups proportionally.
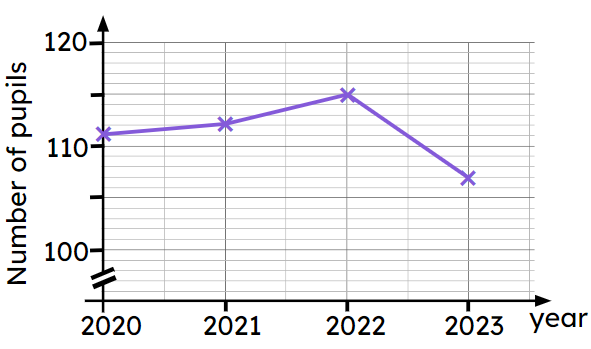
Time series graph - Time series graphs show data over a time period. The time period is always shown on the x-axis. Data points are joined chronologically by line segments.
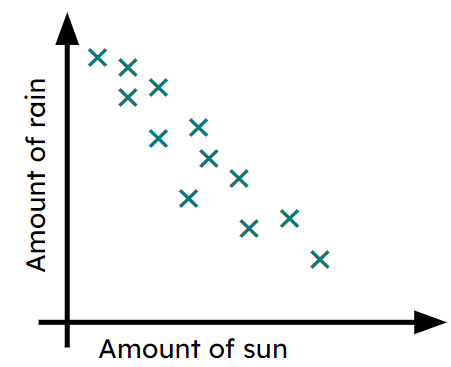
Scatter graph - A scatter graph is a visual representation for bivariate data. It can be useful when determining the nature of the relationship between the two variables.
Common misconception
Pupils may think that drawing a graph with a broken axis is incorrect.
It is fine to do this (and is sometimes necessary) but it is important to acknowledge this when trying to draw conclusions from the graph.
You may wish to ask your pupils to investigate graphs in the media and to bring examples of these graphs to the lesson where they can be discussed. Pupils could present on what the graph is showing and why it is misleading (or not).

Teacher tip

Equipment

Licence
This content is © Oak National Academy Limited (2025), licensed on Open Government Licence version 3.0 except where otherwise stated. See Oak's terms & conditions (Collection 2).
Lesson video
Loading...
Prior knowledge starter quiz
6 Questions
Q1.What label is on the $$x$$ axis?
What label is on the $$x$$ axis?
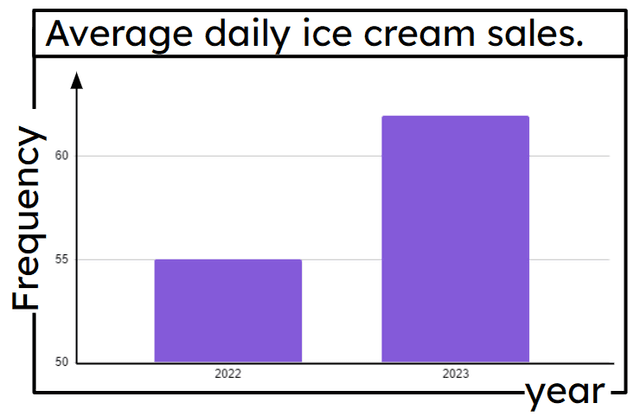
Average daily ice cream sales
Frequency

Correct answer: year
year
Q2.What label is on the $$y$$ axis?
What label is on the $$y$$ axis?
Average daily ice cream sales
Correct answer: Frequency
Frequency
year
Q3.What does this bar chart show?
What does this bar chart show?
The number of ice creams sold each year.
The average number of ice creams sold each year.
The number of ice creams sold each day for each year.
Correct answer: The average number of ice creams sold each day for each year.
The average number of ice creams sold each day for each year.
Q4.What type of graph is this?
What type of graph is this?
Bar graph
Pictograph
Pie graph
Correct answer: Scatter graph
Scatter graph
Q5.What type of correlation (if any) is shown here?
What type of correlation (if any) is shown here?
Correct answer: Negative correlation
Negative correlation
No correlation
Positive correlation
Q6.Which statements best fit the graph?
Which statements best fit the graph?
As the amount of rain increases, the amount of sun also increases.
As the amount of rain decreases, the amount of sun also decreases.
Correct answer: As the amount of rain decreases, the amount of sun increases.
As the amount of rain decreases, the amount of sun increases.
Correct answer: The more rain we have, the less sun we have.
The more rain we have, the less sun we have.
Assessment exit quiz
6 Questions
Q1.'Local shops see devastating drop in the number of pupils visiting them in 2023.' What reason explains why the graph may not support the headline?
'Local shops see devastating drop in the number of pupils visiting them in 2023.' What reason explains why the graph may not support the headline?
The year starts at 2020
Correct answer: The $$y$$ axis has a broken scale.
The $$y$$ axis has a broken scale.
Not all shops have been surveyed.
Not all pupils have been surveyed.
Q2.What is the difference between the number of pupils in 2021 and 2022?
What is the difference between the number of pupils in 2021 and 2022?
Correct Answer: 3, Three
3, Three
Q3.A pie chart (pie graph) is a graph where sectors represent different groups proportionally.
A pie chart (pie graph) is a graph where sectors represent different groups proportionally.
Correct Answer: circular
circular
Q4.A scatter graph is a visual representation for data.
A scatter graph is a visual representation for data.
Correct Answer: bivariate, two types of
bivariate, two types of
Q5.If two things are correlated then one must cause the other.
If two things are correlated then one must cause the other.
True - positive correlation means as one variable increases, so does the other.
Correct answer: False - there may be a third factor affecting both or coincidence.
False - there may be a third factor affecting both or coincidence.
Q6.In what ways could a chart be manipulated to make one element appear significantly bigger than it really is?
In what ways could a chart be manipulated to make one element appear significantly bigger than it really is?
Correct answer: Draw a 3D pie chart, at an angle, with the sector for that element at the front.
Draw a 3D pie chart, at an angle, with the sector for that element at the front.
Correct answer: Draw a bar chart and leave numbers off the frequency axis.
Draw a bar chart and leave numbers off the frequency axis.
Draw a 2D pie chart, at an angle, with the sector for that element at the front.
Draw a 3D bar chart with the bar for that element in the background.
