


- Year 11
Moving between tables and histograms
I can construct a table from a histogram.
Lesson details
Key learning points
- A frequency table can be used to construct a histogram
- A histogram can be used to construct a frequency table
- Data is sometimes collected using uneven class widths
Keywords
Continuous data - Continuous data can take any value within a range. (Height, mass, temperature)
Histogram - A histogram is a diagram consisting of rectangles whose area is proportional to the frequency in each class and whose width is equal to the class interval.
Frequency density - Frequency density is proportional to the frequency per unit for the data in each class. Often, the multiplier is 1 meaning that frequency density = frequency ÷ class width.
Common misconception
Histograms with unequal bar widths are plotted against the frequency and/or pupils read the frequency density as the frequency of the class width.
Show what a histogram with unequal bar widths looks like when plotted against frequency. This visual aid will show pupils the distribution of data is difficult to see.


Licence
Lesson video
Loading...
Prior knowledge starter quiz
6 Questions
Q1.Frequency density is proportional to the frequency per unit for the data in each class. Often, the multiplier is 1 meaning...

Q2.Select which statements are true.
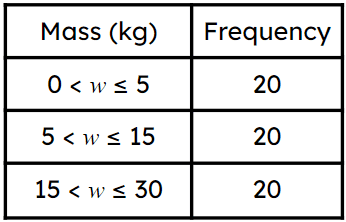
Q3.Here is some data on the masses of parcels. Which class interval shows a frequency density of 2?
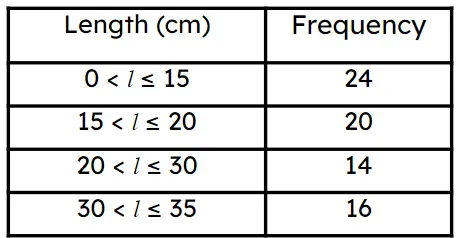
Q4.Here is some data on the lengths of some string. Which class interval shows a frequency density of 1.4?
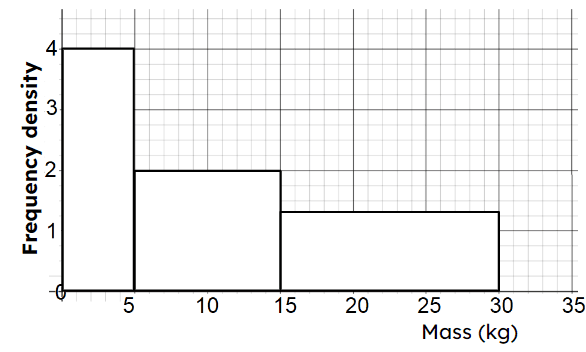
Q5.The histogram shows the masses of different parcels. How many parcels have a mass between 5 and 15 kg?
Q6.Select which of the following statements are true given a histogram with unequal bar widths plotted against frequency density.
Assessment exit quiz
6 Questions
Q1.Which of the following shows the frequency in a histogram with unequal bar widths?
Q2.Here are the times taken to type the alphabet. Match the class intervals with the correct frequency density.
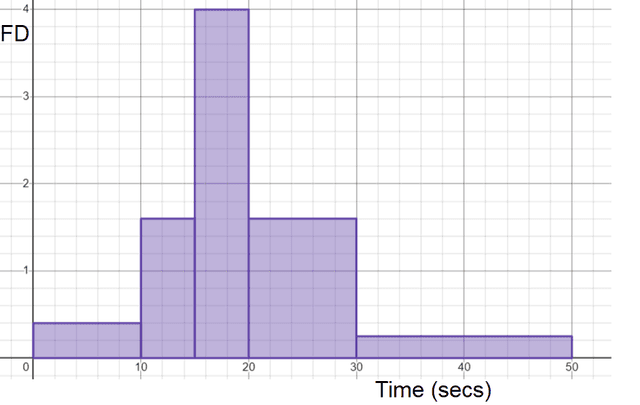
$$0 < t \leq 10$$ - Frequency density = 0.4
$$10 < t \leq 15$$ - Frequency density = 1.6
$$15 < t \leq 20$$ - Frequency density = 4
$$30 < t\leq 50$$ - Frequency density = 0.25
Q3.Here is some data on the lengths of some parcels. Match the frequency with the class interval.
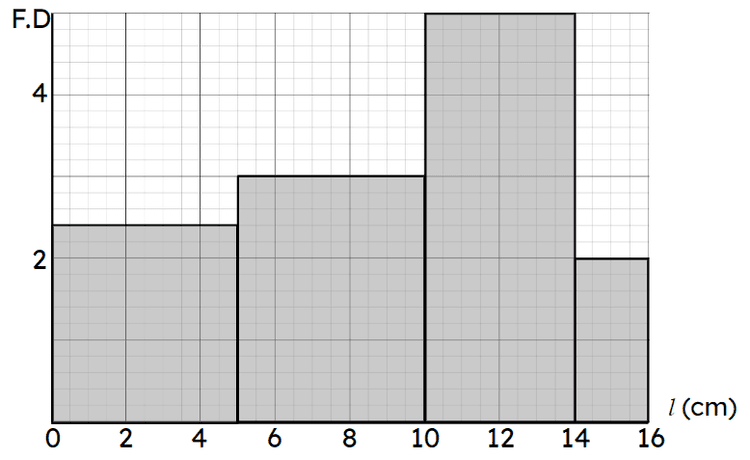
$$0 < l \leq 5$$ - 12
$$5 < l \leq 10$$ - 15
$$10 < l \leq 14$$ - 20
$$15< l \leq 16$$ - 4
Q4.Here is a histogram showing lengths of different fruit. Which numbers represent $$x$$, $$y$$ and $$z$$ on the $$y$$ axis?
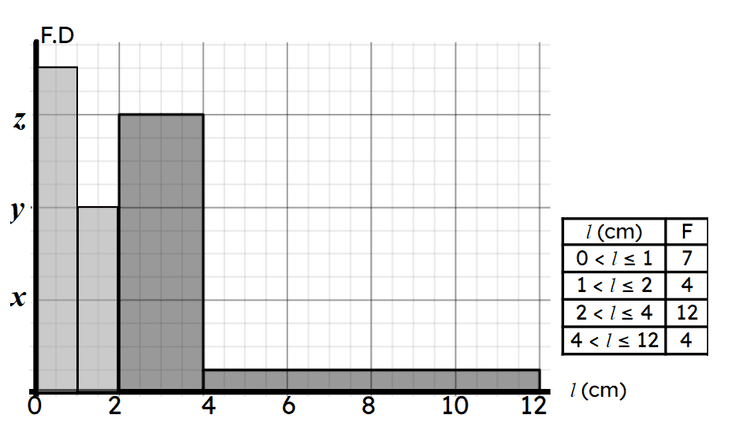
Q5.Here are the times taken to type the alphabet. Match the class interval to the correct frequency.
$$0 < t \leq 10$$ - Frequency = 4
$$10 < t \leq 15$$ - Frequency = 8
$$15 < t \leq 20$$ - Frequency = 20
$$20 < t \leq 30$$ - Frequency = 16
$$30 < t\leq 50$$ - Frequency = 5
Q6.Here is a histogram showing the time it takes to solve a puzzle.
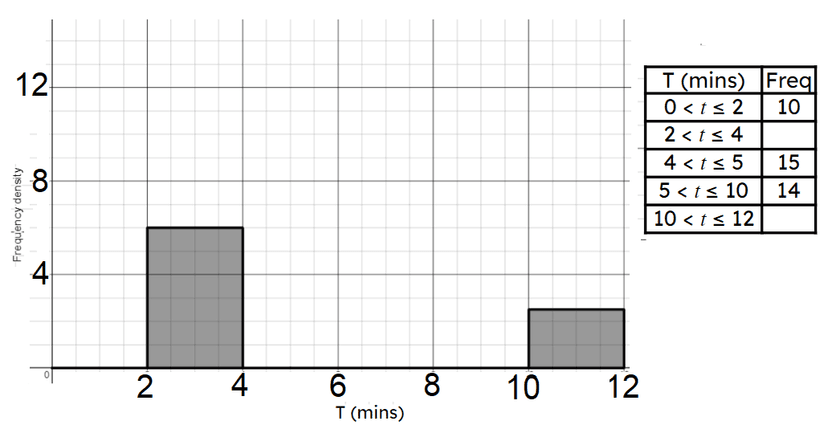
$$0 < t\leq 2$$ - Frequency = 10
$$2 < t \leq 4$$ - Frequency density = 6
$$4 < t \leq 5$$ - Frequency = 15
$$5 < t\leq 10$$ - Frequency density = 2.8
$$10 < t \leq 12$$ - Frequency density = 2.5
