Reducing friction: analysis
I can analyse data from an investigation to test the effectiveness of different lubricants.


- Year 7
Reducing friction: analysis
I can analyse data from an investigation to test the effectiveness of different lubricants.
Lesson details
Key learning points
- Categoric variables come in distinct types. Continous variables can take any value on a numerical scale.
- Bar charts are used when the variable you changed in an experiment is categoric.
- An effective lubricant reduces the friction force.
- A conclusion states what you found out in an experiment and also explains how you know.
Keywords
Lubricant - A lubricant is a substance added between two surfaces to reduce friction.
Friction - Friction is the force of one surface gripping or rubbing on another.
Categoric - A variable is categoric if it comes in distinct, separate categories.
Continuous - A variable is continuous if it can take any value, including decimals, on a scale of numbers.
Conclusion - A conclusion states what you found out in an experiment and explains how you know.
Common misconception
The type of graph chosen to represent data can just be personal choice.
Specific kinds of graph should be chosen to represent specific kinds of data.


Licence
Lesson video
Loading...
Prior knowledge starter quiz
6 Questions
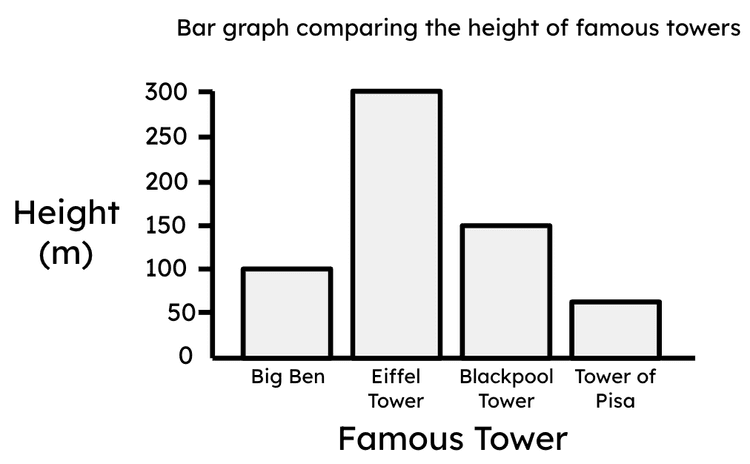
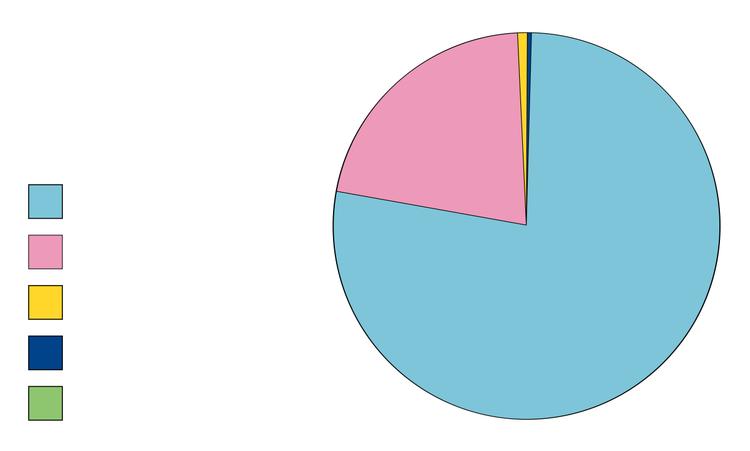
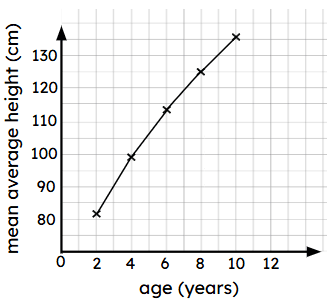
Q1.Which picture shows a bar chart?

Q2.In an experiment, anything that could change (vary) between tests is called a ...
Q3.Which option correctly describes what an experiment conclusion should contain?
Q4.Which kind of force does a lubricant reduce?
Q5.Which one of these variables comes in different categories?
Q6.Identify the possible benefits of lubricating moving parts of a system, to reduce the friction.
Assessment exit quiz
6 Questions
Q1.A is any substance added between two surfaces to reduce the friction forces.
Q2.Which part of an experiment write-up states what you found out and explains how you know?
Q3.Which of the below is the name for a variable that comes in distinct, separate types or categories?
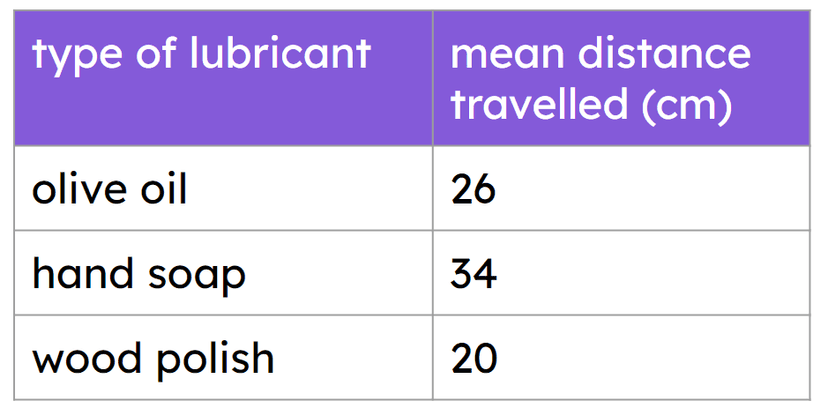
Q4.Jun did an experiment to test how far objects slide across a surface lubricated with different lubricants. His results are in the table. Which of the below is a correct conclusion from Jun's results?
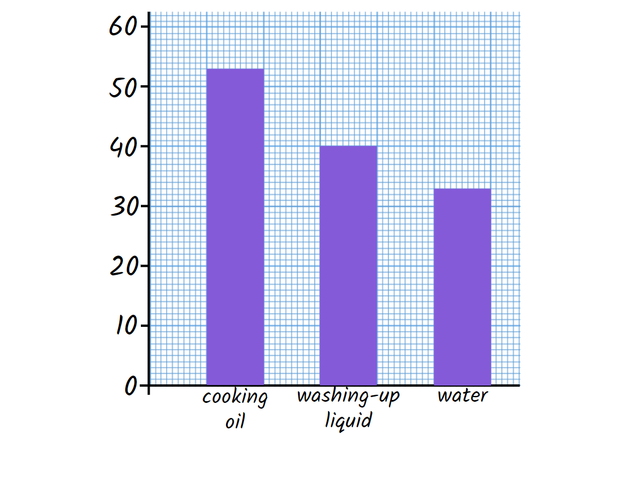
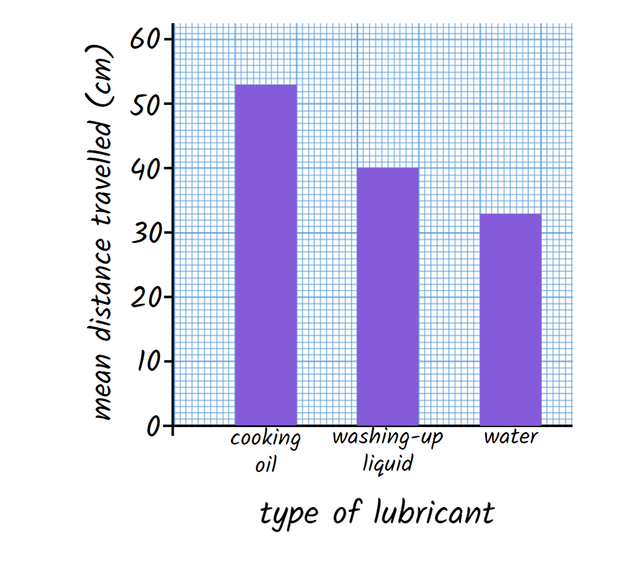
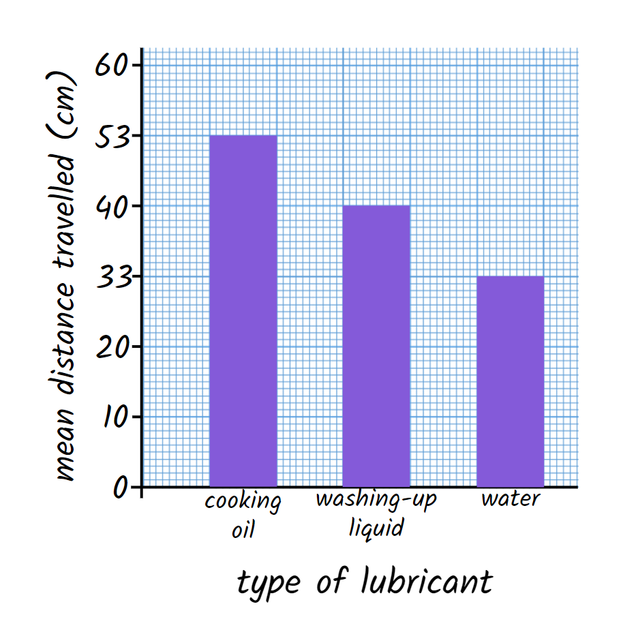
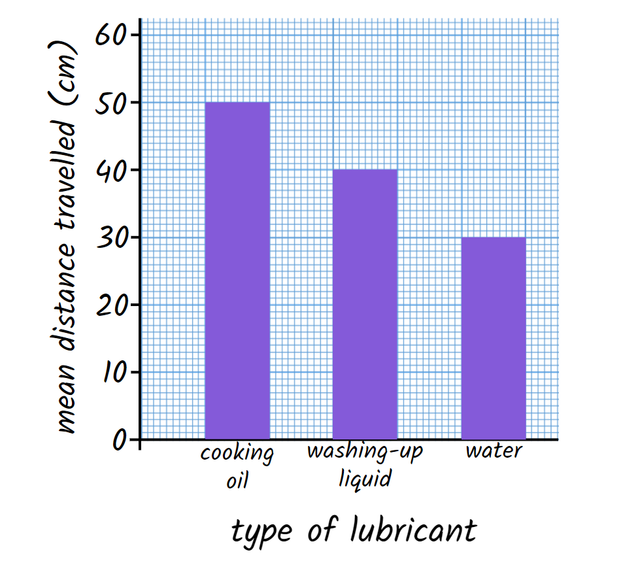
Q5.Izzy tested how far masses slide with different lubricants. The mass slid 53 cm on cooking oil, 40 cm on washing-up liquid and 33 cm on water. Which is the best bar chart of these results?
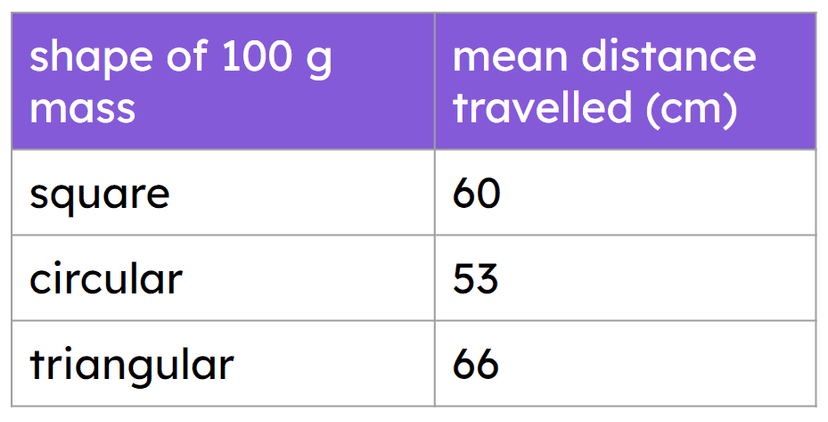
Q6.Laura tested how far different shaped 100 g masses slide across the same surface. Her results are shown in the table. Which option correctly explains what type of graph Laura should draw?