


New
New


Lesson 3 of 11
New
New
- Year 8
Securing constructing bar charts by hand
I can construct bar charts from data.
Lesson details
Key learning points
- Data presented as a list can be represented as a bar chart
- Data presented in a table can be represented as a bar chart
- The type of data determines how the bars should be drawn
Keywords
Frequency - The frequency is the number of times an event occurs; or the number of individuals (people, animals etc.) with some specific property.
Bar chart - A bar chart (bar graph) is a graph consisting of bars visually representing the frequency of objects or groups.
Data - Data are a collection of information.
Common misconception
Pupils may label the vertical axis with the frequency values rather than a scale.
Remind the pupils that the scale should go up in the same jumps. i.e. 0, 5, 10, 15 etc and have them check theirs.
If your pupils showed good understanding of bar charts from lesson 1 of this unit, then you may wish to skip this lesson.

Teacher tip

Licence
This content is © Oak National Academy Limited (2025), licensed on Open Government Licence version 3.0 except where otherwise stated. See Oak's terms & conditions (Collection 2).
Lesson video
Loading...
Prior knowledge starter quiz
6 Questions
Q1.Rectangle is the longest.
Rectangle is the longest.


Q2.These tally marks show a value of .
These tally marks show a value of .

Q3.Which of these numbers are multiples of 15?
Which of these numbers are multiples of 15?
95
130
Q4.A pictogram (pictograph) is a graph consisting of pictures to visually represent the of objects or groups.
A pictogram (pictograph) is a graph consisting of pictures to visually represent the of objects or groups.
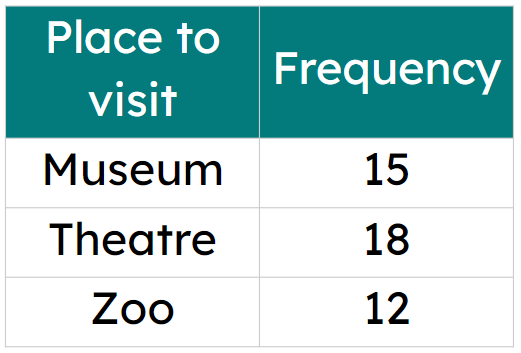
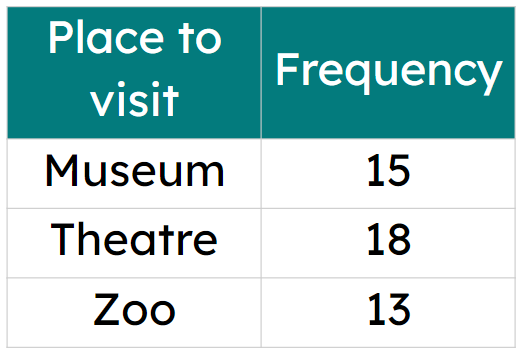
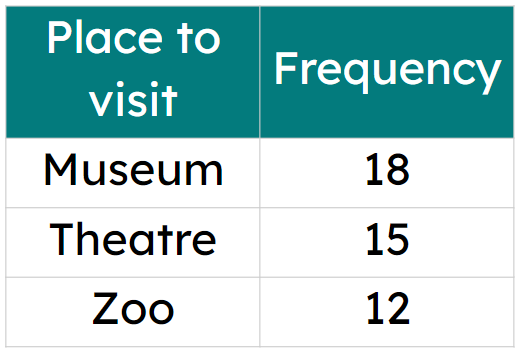
Q5.Select the frequency table that has a total frequency of 46.
Select the frequency table that has a total frequency of 46.
Q6.Some things are measured and some are counted. Which of these are counted?
Some things are measured and some are counted. Which of these are counted?
heights of a group of people
weights of some pet dogs
Assessment exit quiz
6 Questions
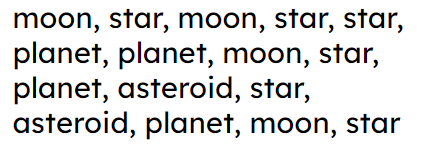
Q1.The total frequency for this data set is .
The total frequency for this data set is .
Q2.If a bar chart was to be constructed for data about favourite pizza toppings in a class, the bars would have a specific order. True or false?
If a bar chart was to be constructed for data about favourite pizza toppings in a class, the bars would have a specific order. True or false?
True - order from the most favourite to the least favourite topping
Q3.This is an example of a __________ bar chart.
This is an example of a __________ bar chart.
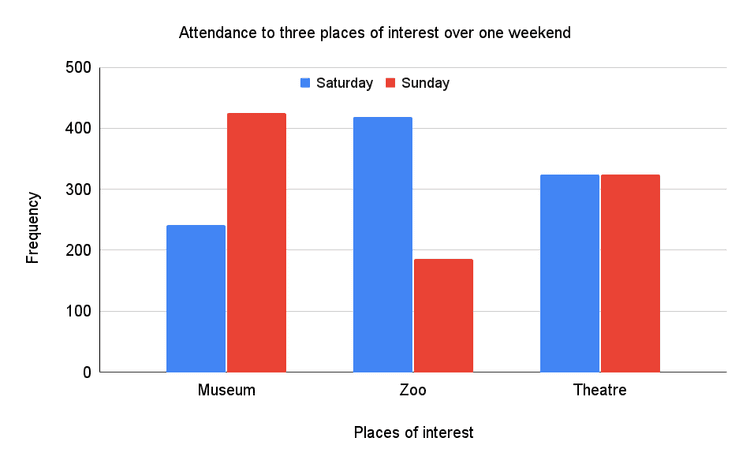
standard
stacked
Q4.The frequency axis needs to have a suitable scale for the data it is presenting. The scale will go up in increments.
The frequency axis needs to have a suitable scale for the data it is presenting. The scale will go up in increments.
Q5.Three pupils are discussing this bar chart. Who is correct with their observation?
Three pupils are discussing this bar chart. Who is correct with their observation?
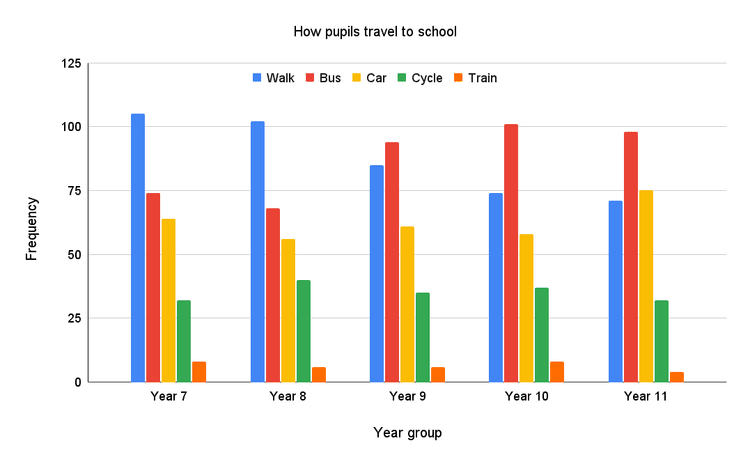


Q6.Which bar chart matches this data?
Which bar chart matches this data?


