


Seed dispersal: data analysis
I can display data as a graph or chart and identify patterns to conclude on the relationship between the independent and dependent variable.


- Year 9
Seed dispersal: data analysis
I can display data as a graph or chart and identify patterns to conclude on the relationship between the independent and dependent variable.
Lesson details
Key learning points
- Experimental data can be analysed by plotting data on a line graph or bar chart.
- Line graphs are used where the independent variable is continuous; bar charts are used where it is categoric.
- Drawing a bar chart and/or line graph follows a set format.
- A line of best fit on a line graph indicates the trend (relationship between in the independent and dependent variable).
Keywords
Line graph - A line graph displays data where the independent and dependent variables are continuous.
Bar chart - A bar chart displays data where the independent variable is categoric.
Line of best fit - A smooth line on a line graph that indicates the trend in the data is called the line of best fit.
Trend - A trend is a pattern in the data that shows the relationship between the independent and dependent variable.
Common misconception
Labelling the x-axis with the values investigated instead of an evenly spaced range; or putting the axes the wrong way round for independent and dependent variables.
Clearly showing the placement of variables in the table and on the graphs, step-by-step guidance of drawing the graphs.


Licence
Lesson video
Loading...
Prior knowledge starter quiz
6 Questions
Q1.Match the variable to its description.

Q2.In the following investigation what is the dependent variable?
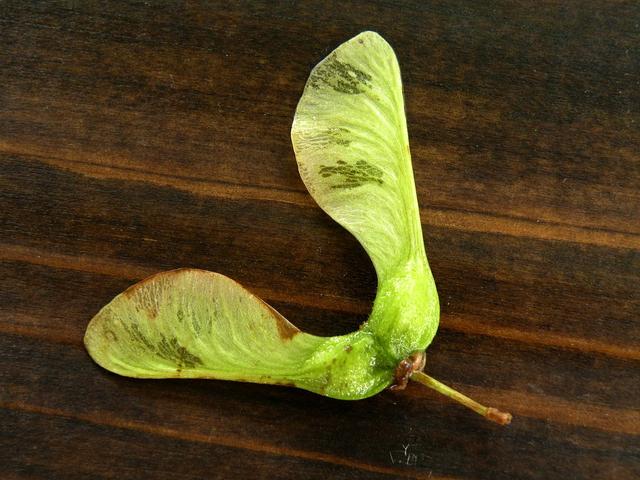
How wing shape affects the distance seeds disperse.
Q3.In an investigation what do you use to collect your result in?
Q4.In this investigation what is the independent variable?
How distance from a light source effects the number of seed germinating.
Q5.When you collect repeat readings you can calculate a
Q6.What is an anomalous result?
Assessment exit quiz
6 Questions
Q1.Match the type of graph or chart to its use.
Q2.Put the following steps in order.
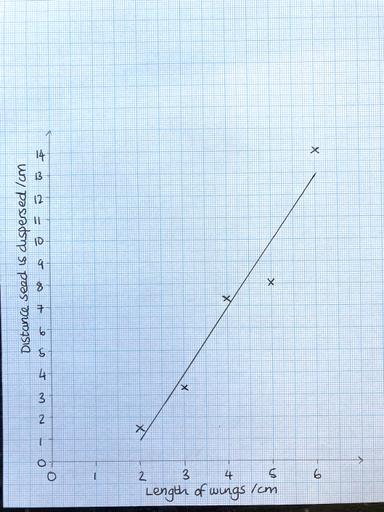
Q3.What does this data show?
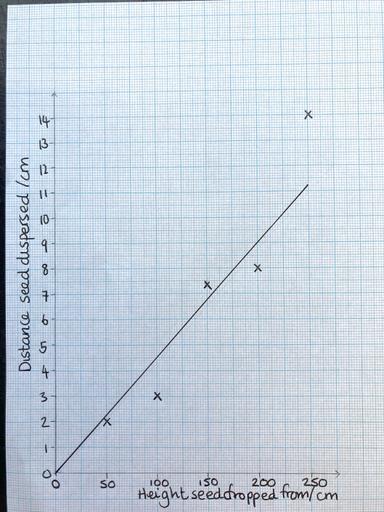
Q4.Match the variable to the axis it is plotted on.
Q5.What is the dependent variable on this bar chart?
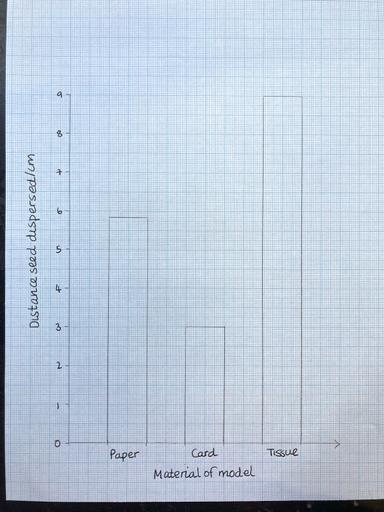
Q6.Which conclusions can be drawn form this bar chart?
