Solubility: analysis
I can draw an appropriate representation of solubility data and use it to write a conclusion.


- Year 7
Solubility: analysis
I can draw an appropriate representation of solubility data and use it to write a conclusion.
Lesson details
Key learning points
- Scientists transfer data to graphs in order to find any trends in the collected data.
- The type of data collected affects the type of graph used to present it.
- A line of best fit can help to identify and describe relationships between variables.
- Conclusions refer to both the independent and dependent variables when describing the data collected.
Keywords
Discrete data - Data that can only take distinct values or is a category, e.g. shoe size, number of people.
Continuous data - Data that can be a value within a range, e.g. temperature, mass, height, etc.
Bar chart - Chart showing solid columns to present data; usually used when one variable is discrete.
Scatter graph - A graph in which two continuous variables are plotted. It is used to find if a relationship exists between the variables.
Line of best fit - A line of best fit is drawn through a set of plotted points on a scatter graph, to best show the trend in the data displayed.
Common misconception
Pupils commonly confuse discrete & continuous data. They also think lines of best fit are straight.
Link *how* the data is collected to the type of data it is. Stress that best fit lines are just that - a best fit - they aren't exact!


Licence
Lesson video
Loading...
Prior knowledge starter quiz
6 Questions
Q1.What is the role of an independent variable in an experiment?
Q2.What is the primary reason for recording data in a table during an experiment?
Q3.When results from an experiment are reproduced by different people or in different places, it is known as...
Q4.A well-designed scientific experiment should yield the same results regardless of who conducts it. True or false?
Q5.A piece of data that does not fit an obvious trend is known as...
Q6.Match the keywords to the descriptions below.

Assessment exit quiz
6 Questions
Q1.Data that can only take specific, distinct values is called data.
Q2.A scatter graph is the most appropriate choice for representing data when both variables are discrete. True or false?
Q3.Which of the following should always be included when writing a conclusion to an investigation?
Q4.When drawing a line of best fit on a graph, any results that are will be ignored.
Q5.What type of graph is typically used when one variable is discrete?
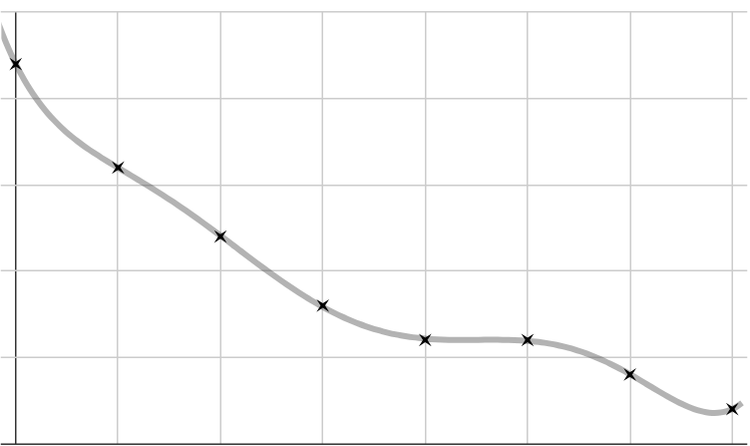
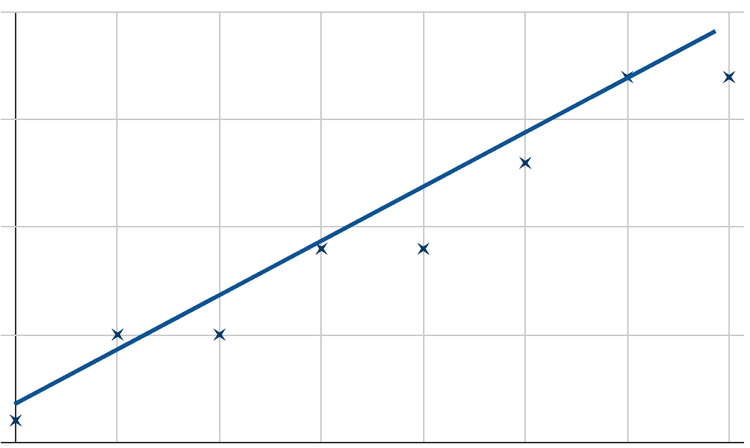
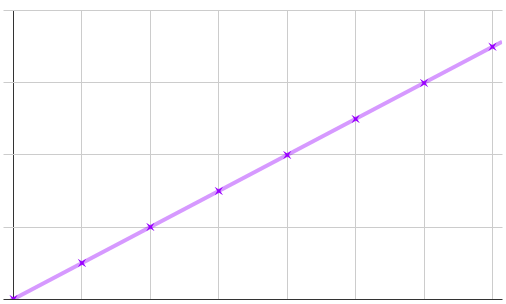
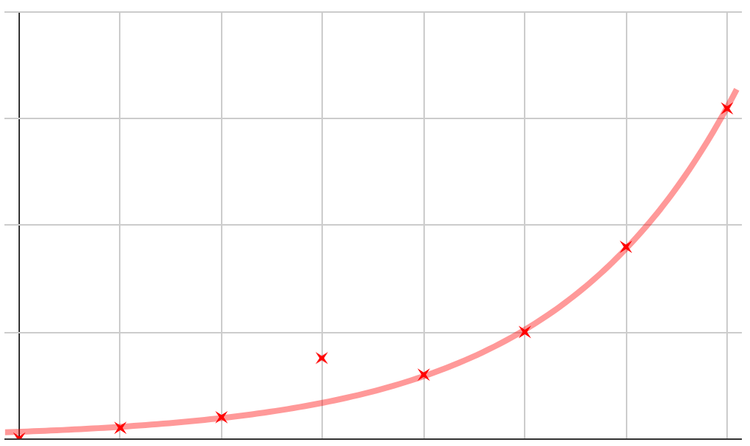
Q6.Which of the following graphs below show a suitable line of best fit based on the data plotted?