


New
New


Lesson 9 of 10
New
New
- Year 3
Solve problems involving length
I can solve problems involving length.
Lesson details
Key learning points
- Data can be collected to help solve a problem involving length.
- When we collect data, we need to decide which units to measure in: mm, cm or m.
- Representing data as a bar graph can help us interpret the data.
Keywords
Data - Data is a collection of facts, such as numbers, words, measurements, observations or even just descriptions of things.
Interpret - When we interpret anything, including data, we explain its meaning.
Common misconception
Drawing tables and graphs from scratch can be tricky for some children.
Provide scaffolds of tables and graphs where necessary.
Complete this lesson practically where possible encouraging 'point in time' measurements so that the data can be considered discrete. Cross-curricula links to science and using the data handling cycle in science.

Teacher tip

Licence
This content is © Oak National Academy Limited (2025), licensed on Open Government Licence version 3.0 except where otherwise stated. See Oak's terms & conditions (Collection 2).
Lesson video
Loading...
Prior knowledge starter quiz
6 Questions
Q1.Which measuring unit would you use to measure the height of a kitten?
Which measuring unit would you use to measure the height of a kitten?
mm
m
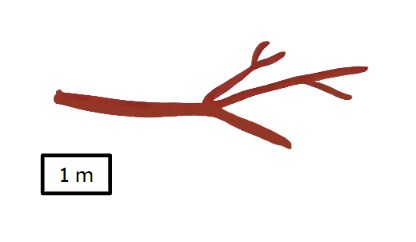
Q2.Estimate the length of this branch.
Estimate the length of this branch.
1 m
2 m
10 m
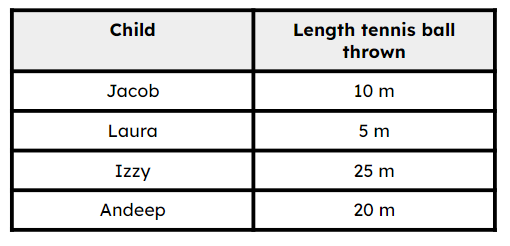
Q3.Look at this table. Starting with the child who threw the shortest distance, order the children by how far they threw the tennis ball.
Look at this table. Starting with the child who threw the shortest distance, order the children by how far they threw the tennis ball.
Q4.Look at the bar graph comparing the height of some famous towers. Match the tower to its height.
Look at the bar graph comparing the height of some famous towers. Match the tower to its height.
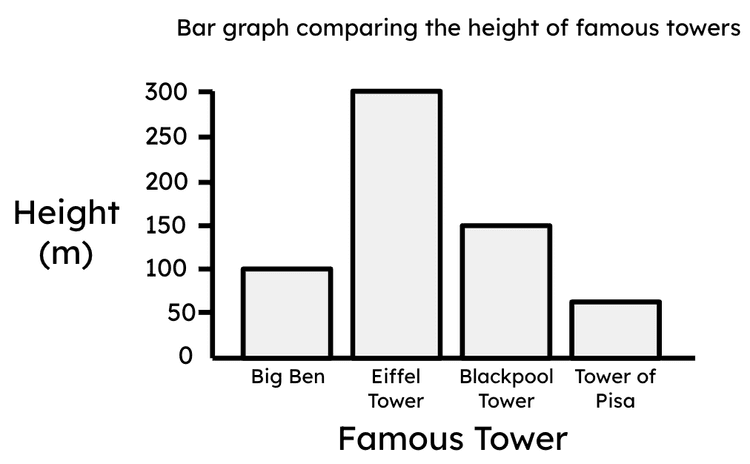

Q5.Look at the bar graph comparing the height of some famous towers. Which tower is the tallest?
Look at the bar graph comparing the height of some famous towers. Which tower is the tallest?
Big Ben
Blackpool Tower
Leaning Tower of Pisa
Q6.Look at the bar graph comparing the height of some famous towers. How much taller is the Eiffel Tower than the Leaning Tower of Pisa (which is 60 m tall)?
Look at the bar graph comparing the height of some famous towers. How much taller is the Eiffel Tower than the Leaning Tower of Pisa (which is 60 m tall)?
60 m
300 m
360 m
Assessment exit quiz
6 Questions
Q1.Explaining the meaning of something, such as data is known as .
Explaining the meaning of something, such as data is known as .
data
table
graph
Q2.Laura is wondering if the famous towers that she knows are all taller than 100 m. Match the part of the data handling cycle to what Laura will need to do.
Laura is wondering if the famous towers that she knows are all taller than 100 m. Match the part of the data handling cycle to what Laura will need to do.
Q3.Look at the graph comparing the heights of the famous towers. Are all towers taller than 100 m?
Look at the graph comparing the heights of the famous towers. Are all towers taller than 100 m?
Yes
Q4.Andeep wants to know if all children in his Year 3 class can kick a ball further than 30 m. Starting with the first step, order these statements to help Andeep decide what he needs to do.
Andeep wants to know if all children in his Year 3 class can kick a ball further than 30 m. Starting with the first step, order these statements to help Andeep decide what he needs to do.
Q5.Looking at the graph that Andeep drew, what can you interpret? Tick each option that is a correct interpretation.
Looking at the graph that Andeep drew, what can you interpret? Tick each option that is a correct interpretation.

Andeep kicked the ball 30 m further than Izzy.
Laura kicked the ball 55 m.
Q6.Looking at the graph that Andeep drew, did all children kick the ball further than 30 m?
Looking at the graph that Andeep drew, did all children kick the ball further than 30 m?
No
