


New
New


Lesson 6 of 9
New
New
- Year 9
Studying climate change
I can understand how Earth's polar ice caps are changing.
Lesson details
Key learning points
- By analysing how the northern polar ice caps have changed, predictions can be made
- By analysing how the southern polar ice caps have changed, predictions can be made
Keywords
Forecast - A forecast is a prediction of a future event occurring (based on data).
Extrapolation - Extrapolation is the process of estimating unknown values that are outside the range of existing data.
Common misconception
When comparing the modal class for two datasets, pupils may think that the dataset with the greatest modal class is the one which has the greatest frequency for its modal class
Use the frequency to identify the modal class for each dataset, but then compare the values within each class to determine which dataset has the greatest modal class.
This lesson uses types of statistical graphs which pupils may not have previous encountered. However, pupils do not need a detailed understanding of these graphs to solve the problems in this lesson. Problems request only general conclusions about the data based on its shape or basic comparisons.

Teacher tip

Equipment

Licence
This content is © Oak National Academy Limited (2025), licensed on Open Government Licence version 3.0 except where otherwise stated. See Oak's terms & conditions (Collection 2).
Lesson video
Loading...
Prior knowledge starter quiz
6 Questions
Q1.Which town tends to have the highest mean temperature?
Which town tends to have the highest mean temperature?

Town A
Town B

Q2.What is the mode for the data represented by the bar chart?
What is the mode for the data represented by the bar chart?
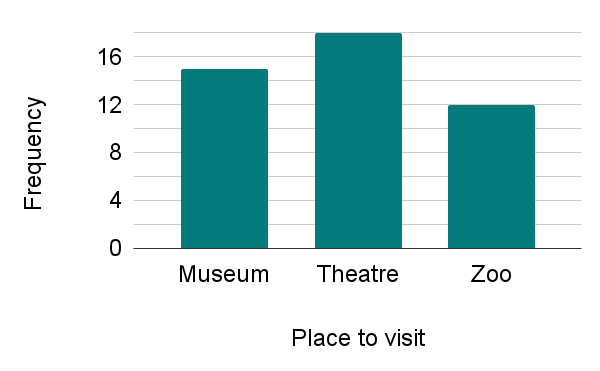
museum
zoo
17
18
Q3.Which statement is true for the data displayed in the graph?
Which statement is true for the data displayed in the graph?

Overall, average house prices have decreased from 2005 to 2024.
Overall, average house prices have stayed the same from 2005 to 2024.
Q4.The graph shows data about the amount of rainfall (mm) for each month of a year. Starting with the least, sort the months in ascending order of rainfall.
The graph shows data about the amount of rainfall (mm) for each month of a year. Starting with the least, sort the months in ascending order of rainfall.

Q5.Which statement is true for the data represented by the bar chart?
Which statement is true for the data represented by the bar chart?
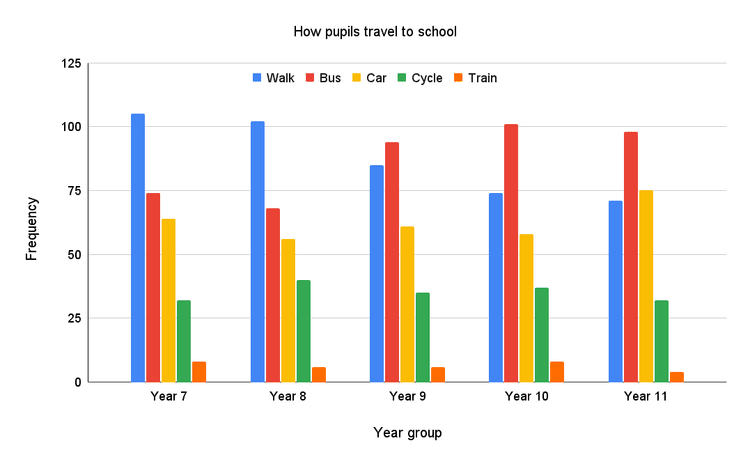
The number of people who walk to school stays the same as the pupils get older.
The number of people who walk to school increases as the pupils get older.
Q6.Which year group contains more pupils who travel to school by car than those who walk?
Which year group contains more pupils who travel to school by car than those who walk?
Year 7
Year 8
Year 9
Year 10
Assessment exit quiz
6 Questions
Q1.Which year in the graph shows the least amount of sea-ice?
Which year in the graph shows the least amount of sea-ice?

Q2.Look at the data displayed in the graph. Which is the modal class?
Look at the data displayed in the graph. Which is the modal class?

-0.4°C to -0.2°C
-0.2°C to 0°C
0.2°C to 0.4°C
1.4°C to 1.6°C
Q3.For each graph, calculate the modal class. Which time period has the modal class with the highest temperature?
For each graph, calculate the modal class. Which time period has the modal class with the highest temperature?

1851 to 1908
1909 to 1966
Q4.Which time period has the greatest range of data?
Which time period has the greatest range of data?
1851 to 1908
1909 to 1966
Q5.Which statement is true, based on the data represented in the graphs?
Which statement is true, based on the data represented in the graphs?

Sea-surface temperatures were generally colder for 1967-2024 than for 1909-1966.
Sea-surface temperatures were generally the same for both periods of time.
Q6.Which statement is true, based on the data represented in the graphs?
Which statement is true, based on the data represented in the graphs?
Sea-surface temperatures were less spread for 1967-2024 than for 1909-1966.
Sea-surface temperatures had a similar spread in both periods of time.
