


New
New
Studying local climate change
I can understand how the UK's weather has changed over a long time.


Lesson 7 of 9
New
New
- Year 9
Studying local climate change
I can understand how the UK's weather has changed over a long time.
Lesson details
Key learning points
- By considering weather data for an area, conclusions can be made about weather trends
- Considering trends in weather data across a larger region can lead to more general conclusions
- Graphical representations can make comparisons easier
Keywords
Forecast - A forecast is a prediction of a future event occurring (based on data).
Extrapolation - Extrapolation is the process of estimating unknown values that are outside the range of existing data.
Climate - Climate is the average weather pattern in an area across a long period of time.
Common misconception
One trend line appearing higher on a graph than a different trend line means the higher line shows more change over time.
It is the gradient of a trend line that informs how quickly something is changing with respect to time.
Pupils may like to access the ONS website and consider data from the nearest weather station to where they live. This data could then be studied as part of this lesson so pupils can see how the climate has changed over time in their local area.

Teacher tip

Equipment

Licence
This content is © Oak National Academy Limited (2025), licensed on Open Government Licence version 3.0 except where otherwise stated. See Oak's terms & conditions (Collection 2).
Lesson video
Loading...
Prior knowledge starter quiz
6 Questions
Q1.__________ is the process of estimating unknown values that are outside the range of existing data.
__________ is the process of estimating unknown values that are outside the range of existing data.
Averaging

Interpolation
Substitution
Q2.The scatter graph shows that as the minimum temperature increases, the maximum temperature generally...
The scatter graph shows that as the minimum temperature increases, the maximum temperature generally...

decreases
stays the same
Q3.Which line has a negative gradient?
Which line has a negative gradient?

B
C
D
Q4.Which statement is true, based on the data shown in the scatter graph?
Which statement is true, based on the data shown in the scatter graph?
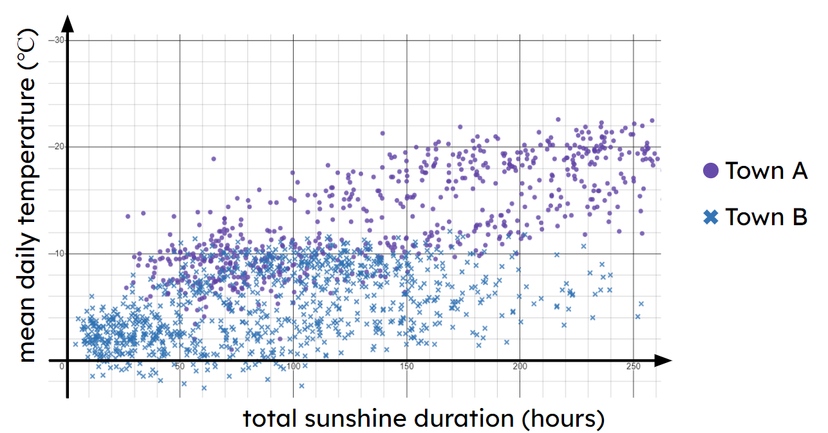
Town B generally tends to be warmer than Town A.
Town A and Town B generally tend to be the same temperature.
Q5.The scatter graph shows data about the number of hours spent revising by a sample of pupils and their marks in a subsequent test. Which statement is true, based on this data?
The scatter graph shows data about the number of hours spent revising by a sample of pupils and their marks in a subsequent test. Which statement is true, based on this data?

Pupils who revised more tended to get a lower mark in the test.
The data shows no association between revision time and test marks.
Q6.A new data point is recorded and has a minimum temperature of 10°C. Based on the scatter graph, which range of values would be a suitable estimate for its maximum temperature?
A new data point is recorded and has a minimum temperature of 10°C. Based on the scatter graph, which range of values would be a suitable estimate for its maximum temperature?
4°C to 7°C
8°C to 11°C
5°C to 20°C
Assessment exit quiz
6 Questions
Q1.The graph shows data from the Met Office about the average number of days with air frost per month from 1941 to 2022, in Nairn and Oxford. Which statement is true, based on this data?
The graph shows data from the Met Office about the average number of days with air frost per month from 1941 to 2022, in Nairn and Oxford. Which statement is true, based on this data?

Nairn tends to have fewer days with air frost than Oxford, per year.
Nairn tends to have the same number of days with air frost as Oxford, per year.
Q2.The graph shows data from the Met Office about the average number of days with air frost per month from 1941 to 2022, in Nairn and Oxford. The trend line for Oxford has a gradient.
The graph shows data from the Met Office about the average number of days with air frost per month from 1941 to 2022, in Nairn and Oxford. The trend line for Oxford has a gradient.
Q3.The graph shows data from the Met Office about the average number of days with air frost per month in two locations. The data suggests that the number of days in Oxford with air frost has...
The graph shows data from the Met Office about the average number of days with air frost per month in two locations. The data suggests that the number of days in Oxford with air frost has...
generally stayed the same during the time period shown.
generally increased during the time period shown.
Q4.The graph shows data from the Met Office about the average annual temperature from 1941 to 2022 in Wick and Oxford. The trend line for each location has a gradient.
The graph shows data from the Met Office about the average annual temperature from 1941 to 2022 in Wick and Oxford. The trend line for each location has a gradient.

Q5.The graph shows data from the Met Office about the average annual temperature from 1941 to 2022 in Wick and Oxford. Which statement is true for the data shown?
The graph shows data from the Met Office about the average annual temperature from 1941 to 2022 in Wick and Oxford. Which statement is true for the data shown?
The average temperature in Oxford has generally decreased over time.
The average temperature in Oxford has generally stayed the same over time.
Q6.The graph shows data from the Met Office about the average annual temperature from 1941 to 2022 in Wick and Oxford. Which statement is true, based on this data?
The graph shows data from the Met Office about the average annual temperature from 1941 to 2022 in Wick and Oxford. Which statement is true, based on this data?
Wick tends to be warmer than Oxford.
Oxford and Wick tend to be a similar temperature.
