


New
New


Lesson 4 of 9
New
New
- Year 9
Understanding weather data
I can interpret a weather report.
Lesson details
Key learning points
- Weather reports contain a considerable amount of data
- This data can be interpreted in real terms
- Weather data can help when making decisions
Keywords
Forecast - A forecast is a prediction of a future event occurring (based on data).
Common misconception
The temperature tells us how hot it will feel.
The temperature given in a weather report is normally the air temperature. The 'feel like' temperature may be different depending on multiple factors.
You could ask pupils to use a weather website (such as BBC weather) to look up the weather report for this week for their location. In groups, pupils could write their own weather report and then present this to the class, using data to justify their predictions.

Teacher tip

Equipment

Licence
This content is © Oak National Academy Limited (2026), licensed on Open Government Licence version 3.0 except where otherwise stated. See Oak's terms & conditions (Collection 2).
Lesson video
Loading...
Prior knowledge starter quiz
6 Questions
Q1.What time is 5pm on a 24-hour clock?
What time is 5pm on a 24-hour clock?
05:00
07:00
15:00

19:00
Q2.What is -3 + 10?
What is -3 + 10?
-13
-7
13
Q3.Find the range of the following numbers: 18, 19, 15, 14, 19
Find the range of the following numbers: 18, 19, 15, 14, 19
17
18
19
Q4.Find the median of the following numbers: 18, 19, 15, 14, 19
Find the median of the following numbers: 18, 19, 15, 14, 19
5
17
19
Q5.Find the mode of the following numbers: 18, 19, 15, 14, 19
Find the mode of the following numbers: 18, 19, 15, 14, 19
5
17
18
Q6.Find the mean of the following numbers: 18, 19, 15, 14, 19
Find the mean of the following numbers: 18, 19, 15, 14, 19
5
18
19
Assessment exit quiz
6 Questions
Q1.The diagram shows the weather forecast for a single day. The temperature at 3 pm is predicted to be °C.
The diagram shows the weather forecast for a single day. The temperature at 3 pm is predicted to be °C.
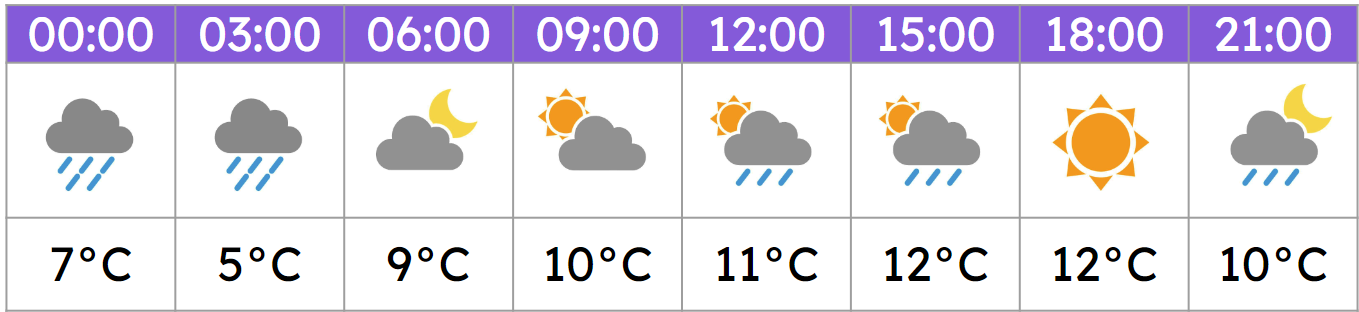
Q2.The weather forecast predicts temperatures with a range of...
The weather forecast predicts temperatures with a range of...
3°C
5°C
12°C
Q3.The median of the temperatures shown in the forecast is °C.
The median of the temperatures shown in the forecast is °C.
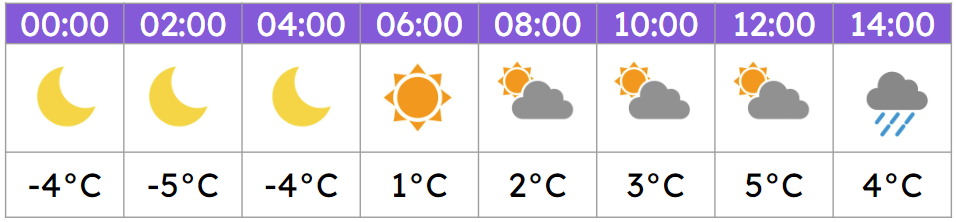
Q4.The diagram shows the weather forecast for a single day. From 4am to 12pm, the temperature is predicted to increase by °C.
The diagram shows the weather forecast for a single day. From 4am to 12pm, the temperature is predicted to increase by °C.
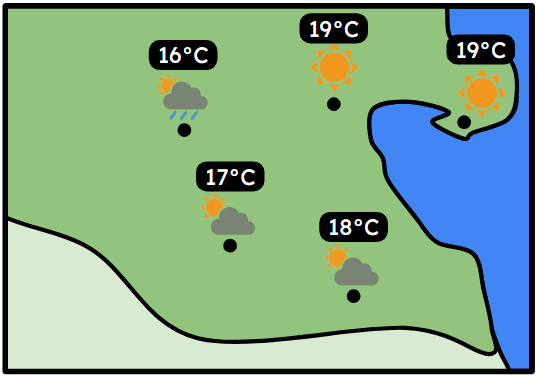
Q5.The modal temperature shown on the map is...
The modal temperature shown on the map is...
4°C
17.8°C
18°C
Q6.The mean of the temperatures shown in the forecast is ___°C.
The mean of the temperatures shown in the forecast is ___°C.
-4°C
1.5°C
2°C
3.5°C
