


New
New
Using graphs to represent lengths and heights
I can represent lengths and heights on a graph and use them to solve problems


Lesson 8 of 10
New
New
- Year 3
Using graphs to represent lengths and heights
I can represent lengths and heights on a graph and use them to solve problems
Lesson details
Key learning points
- Information about length and height from a table can be represented in a bar graph.
- Information represented in a bar graph can be used to solve problems.
Keywords
Graph - A graph is a visual way of showing information. A Bar Graph uses bars of different lengths or heights to represent information.
Axis - An axis on a graph is a fixed measuring line that runs horizontally (left to right) and/or vertically from zero:
Common misconception
Mistakes may be made on comparison problems. E.g. how much further does one child jump than another?
When we compare, we are finding the difference. To find the difference, we need to subtract the smaller value from the larger value.
Bar graphs are used to present discrete data. Data related to length and height might be considered continuous but the way it is used here is for comparison and is a measurement taken at one point in time and so is considered discrete data.

Teacher tip

Licence
This content is © Oak National Academy Limited (2025), licensed on Open Government Licence version 3.0 except where otherwise stated. See Oak's terms & conditions (Collection 2).
Lesson video
Loading...
Prior knowledge starter quiz
6 Questions
Q1.Match the multiples with their times-table.
Match the multiples with their times-table.

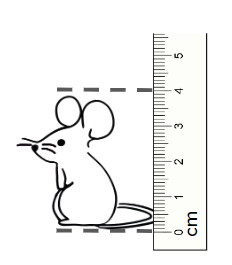
Q2.How tall is this mouse? Tick all the options that apply.
How tall is this mouse? Tick all the options that apply.
4 mm
40 cm
4 m
Q3.Which of these values is the greatest?
Which of these values is the greatest?
120 m
102 m
112 m
Q4.Look at this table showing estimated and actual lengths that children can kick a football. What does the 35 m represent?
Look at this table showing estimated and actual lengths that children can kick a football. What does the 35 m represent?
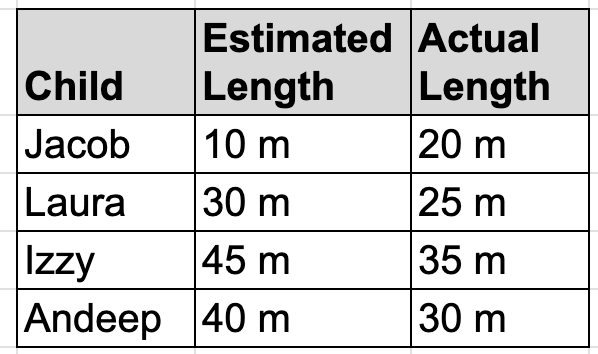
The estimated length that Izzy can kick a football.
The actual length that Andeep can kick a football.
The estimate length that Jacob can kick a football.
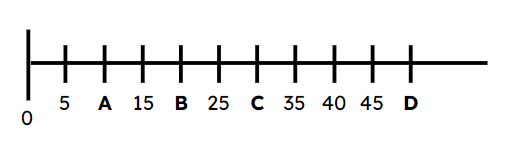
Q5.Match the letters to their appropriate number on this number line.
Match the letters to their appropriate number on this number line.
Q6.Find the difference between 100 and 85.
Find the difference between 100 and 85.

185
25
Assessment exit quiz
6 Questions
Q1.A line on a bar graph that runs horizontally (left to right) from zero is known as .
A line on a bar graph that runs horizontally (left to right) from zero is known as .
the graph
the title
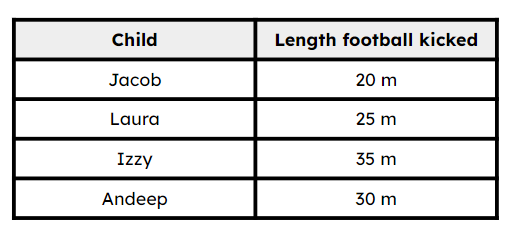
Q2.If we were to represent the data in this table in a bar graph, what maximum value would be needed for the numerical axis?
If we were to represent the data in this table in a bar graph, what maximum value would be needed for the numerical axis?
20
25
30
Q3.If we were to represent the data in this table in a bar graph, what should the numbers labelled on the axis increase in?
If we were to represent the data in this table in a bar graph, what should the numbers labelled on the axis increase in?
Ones
Twos
Tens
Q4.Look at the bar graph comparing the length of some objects. Match the object to its length.
Look at the bar graph comparing the length of some objects. Match the object to its length.
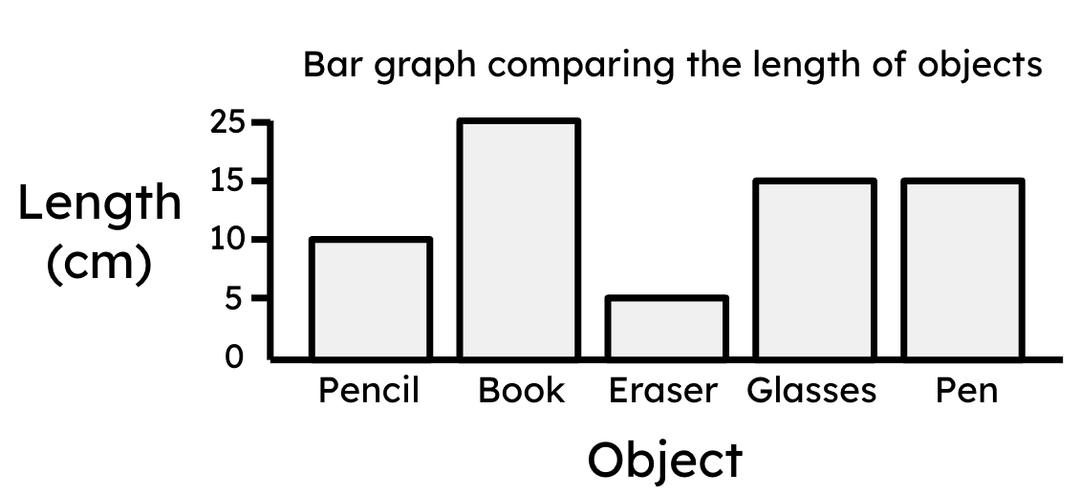
Q5.Look at the bar graph comparing the length of some objects. Which object is the shortest?
Look at the bar graph comparing the length of some objects. Which object is the shortest?
Pencil
Book
Glasses
Pen
Q6.Look at the bar graph comparing the length of some objects. What is the difference in length between the longest and shortest object?
Look at the bar graph comparing the length of some objects. What is the difference in length between the longest and shortest object?
5 cm
25 cm
30 cm
