Choose exam board for KS4 Computer Science (GCSE)
Choose exam board for KS4 English
Choose exam board for KS4 French
Choose exam board for KS4 Geography
Choose exam board for KS4 German
Choose exam board for KS4 History
Choose tier for KS4 Maths
Choose exam board for KS4 Music
Choose exam board for KS4 Physical education (GCSE)
Choose exam board for KS4 Religious education (GCSE)
Choose exam board for KS4 Spanish

      Checking understanding of pictograms and bar charts
      Lesson details

      Learning outcome

      I can interpret both pictograms and bar charts.

      Key learning points

      1. Pictograms represent data through images.
      2. Bar charts represent data using the heights of bars.
      3. A key and/or labelled axes are important for interpreting the representation.

      Keywords

      • Frequency - The number of times an event occurs; or the number of individuals (people, animals etc.) with some specific property.

      Common misconception

      Pupils may forget the key with a pictogram or mislabel the vertical scale for bar charts.

      By asking the pupils how they know there are 'x things', to highlight the need for the key.

      Teacher tip

      If your pupils have shown any need for further work on pictograms and/or bar charts then you may wish to use lesson 2 and 3 of this unit. Real data collected within class is always nice to use when creating their own pictograms and bar charts.

      Licence

      This content is © Oak National Academy Limited (2025), licensed on Open Government Licence version 3.0
      except where otherwise stated. See Oak's terms & conditions
      (Collection 2).

      Lesson video

      Loading...

      Prior knowledge starter quiz

      6 Questions

      Q1.
      $${4 + 4 + 4 + 2 =}$$

      Correct Answer: 14, fourteen

      Q2.
      Which of these have an answer of 24?

      Correct answer: $${3\times 8}$$
      $${2\times 4}$$
      Correct answer: $${6\times 4}$$
      Correct answer: $${2.4\times 10}$$
      $${12\times 3}$$

      Q3.
      What is $${{{1}\over{2}} \text{ of 6}}$$?

      Correct Answer: 3, three

      Q4.
      How many times is the word 'star' in this list? $$\text{moon, star, moon, star, star,}$$$$\text{planet, planet, moon, star,}$$$$\text{planet, asteroid, star, asteroid,}$$$$\text{planet, moon, star}$$

      Correct Answer: 6, six

      Q5.
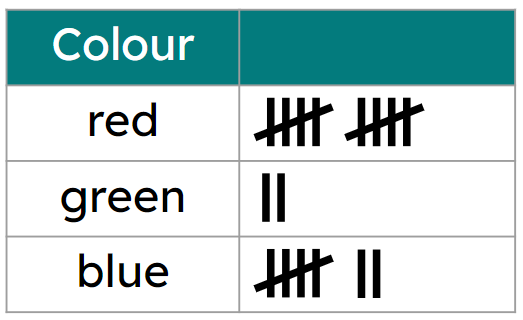
      This is an example of a chart.

      An image in a quiz
      Correct Answer: tally, Tally, TALLY

      Q6.
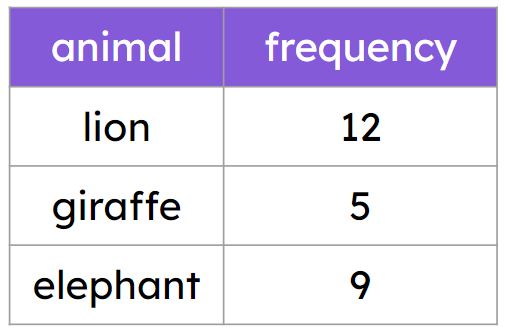
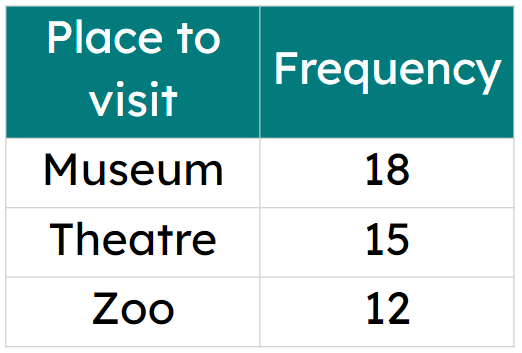
      How many giraffes are represented in this frequency table?

      An image in a quiz
      Correct Answer: 5, five

      6 Questions

      Q1.
      The is the number of times an event occurs; or the number of individuals (people, animals etc.) with some specific property.

      Correct Answer: frequency

      Q2.
      Put the stages of a data investigation in order.

      1 - Plan the investigation
      2 - Collect the data
      3 - Organise and present the data
      4 - Analyse the data
      5 - Make interpretations of the data
      6 - Decide on outcomes and actions

      Q3.
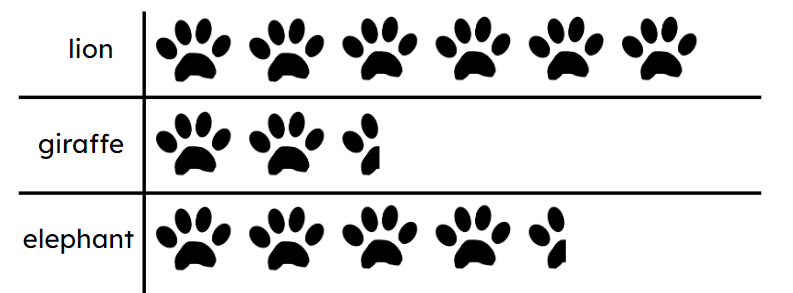
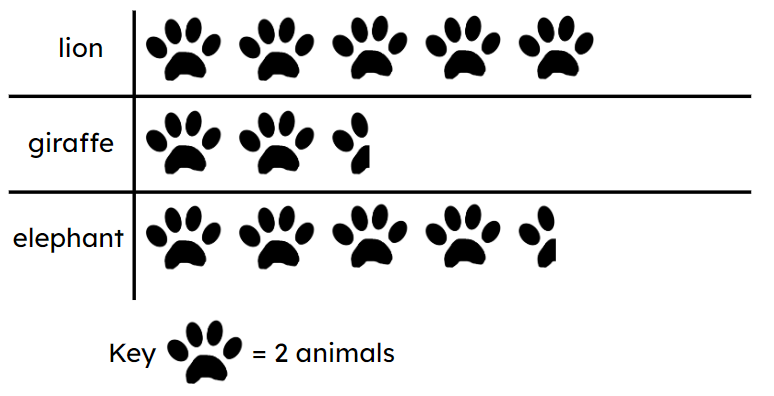
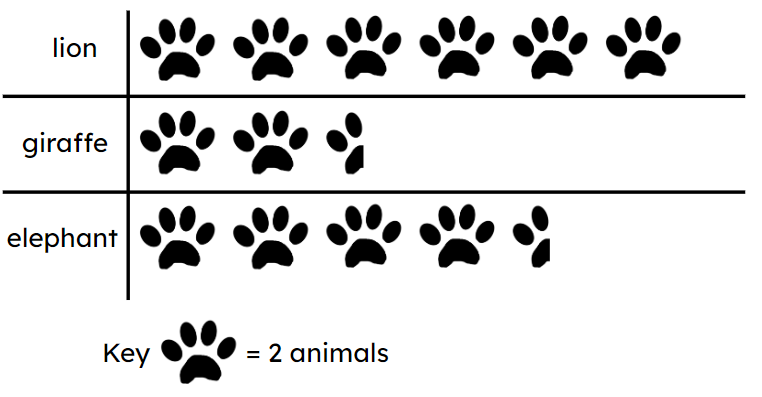
      Which pictogram matches this frequency table?

      An image in a quiz
      An image in a quiz
      An image in a quiz
      Correct Answer: An image in a quiz
      An image in a quiz

      Q4.
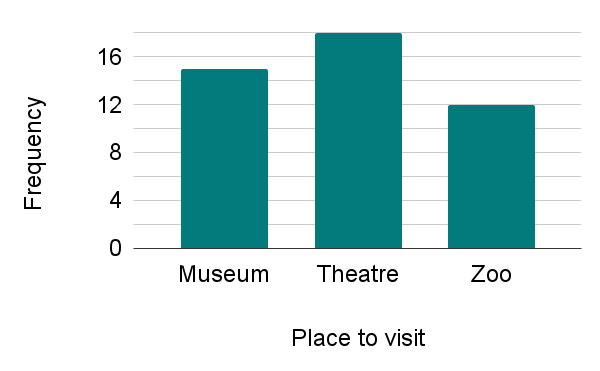
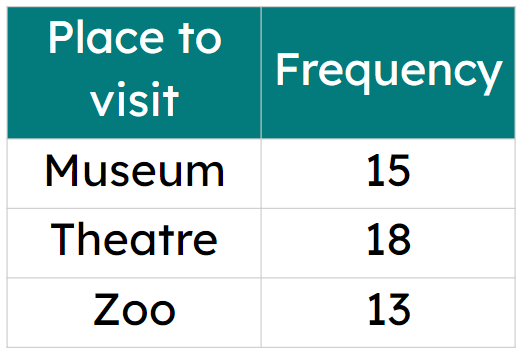
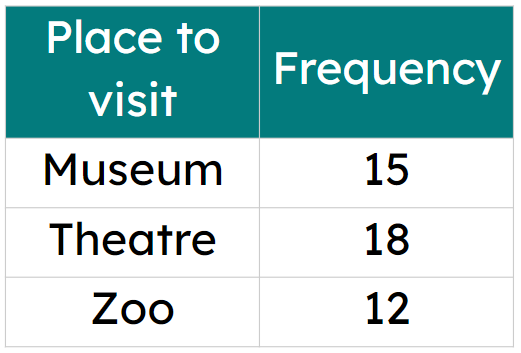
      Which table matches the bar chart?

      An image in a quiz
      An image in a quiz
      Correct Answer: An image in a quiz
      An image in a quiz
      An image in a quiz

      Q5.
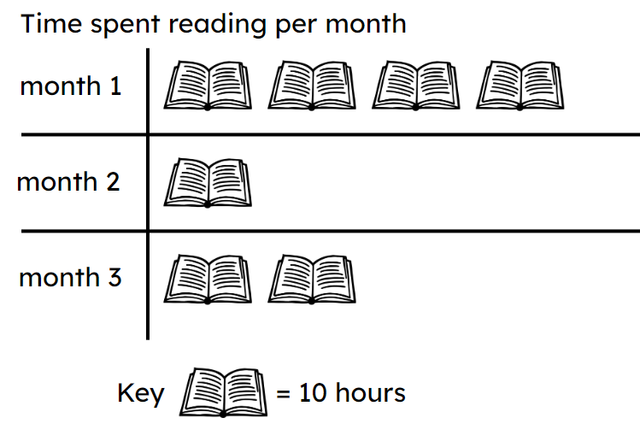
      Which statements are true?

      An image in a quiz
      Correct answer: The most time spent reading was in month 1.
      The least amount of time spent reading was in month 3.
      In month 1 half as much time was spent reading as in month 3.
      Correct answer: In month 3 twice as much time was spent reading as in month 2.
      Correct answer: Over the three months there was 70 hours of reading.

      Q6.
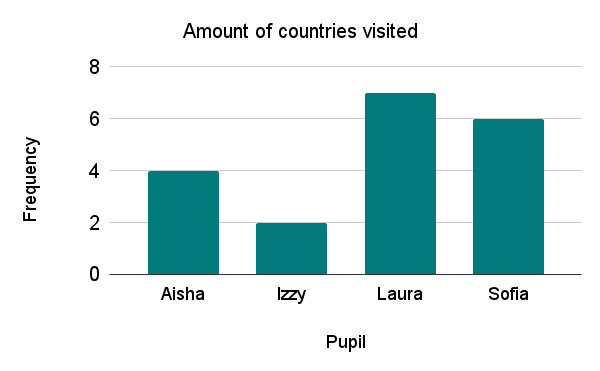
      This bar chart shows that has visited the most countries out of the four pupils.

      An image in a quiz
      Correct Answer: Laura, laura

      To help you plan your 8 maths lesson on: Checking understanding of pictograms and bar charts, download all teaching resources for free and adapt to suit your pupils' needs...