Choose exam board for KS4 Computer Science (GCSE)
Choose exam board for KS4 English
Choose exam board for KS4 French
Choose exam board for KS4 Geography
Choose exam board for KS4 German
Choose exam board for KS4 History
Choose tier for KS4 Maths
Choose exam board for KS4 Music
Choose exam board for KS4 Physical education (GCSE)
Choose exam board for KS4 Religious education (GCSE)
Choose exam board for KS4 Spanish

      Negative rate of change from a graph
      Lesson details

      Learning outcome

      I can calculate the negative rate of change (gradient) from a graph.

      Key learning points

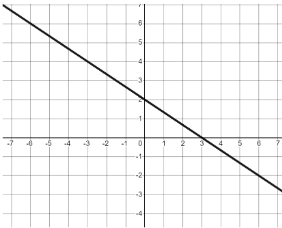
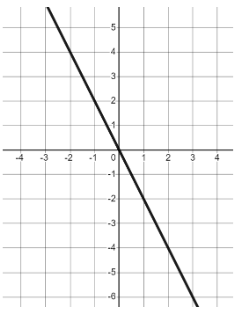
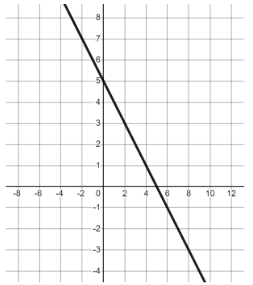
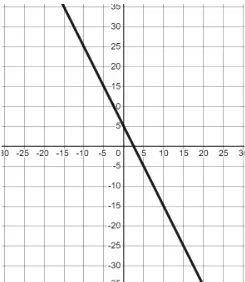
      1. Graphs can be described by looking at how quickly they fall.
      2. The amount y decreases when x increases by one is the rate of change and is called the gradient.
      3. The gradient will be negative if y decreases as the graph moves to the right.
      4. The gradient can be found from any linear graph.
      5. The gradient tells us important information about the relationship.

      Keywords

      • Gradient - The gradient is a measure of how steep a line is.

      • Absolute value - The absolute value of a number is its distance from zero.

      • Parallel - Two lines are parallel if they are straight lines that are always the same (non-zero) distance apart.

      Common misconception

      Pupils may think lines with gradients 2 and -2 are parallel.

      Lines have to have the exact same gradient to be parallel. A line with a negative gradient will intersect a line with a positive gradient .

      Teacher tip

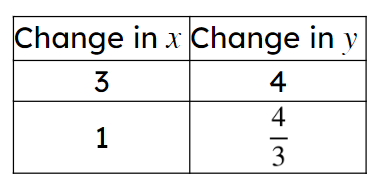
      Use of ratio tables is key to overcoming most common mistakes. Pupils who are confident using ratio tables here, will find it easier to calculate gradient from coordinate pairs later on.

      Licence

      This content is © Oak National Academy Limited (2025), licensed on Open Government Licence version 3.0
      except where otherwise stated. See Oak's terms & conditions
      (Collection 2).

      Lesson video

      Loading...

      Prior knowledge starter quiz

      6 Questions

      Q1.
      Which of these is the correct explanation for how gradient is calculated?

      rate of change in $$x$$ direction with respect to positive $$y$$ direction
      rate of change in $$x$$ direction with respect to negative $$y$$ direction
      rate of change in $$y$$ direction with respect to negative $$x$$ direction
      Correct answer: rate of change in $$y$$ direction with respect to positive $$x$$ direction

      Q2.
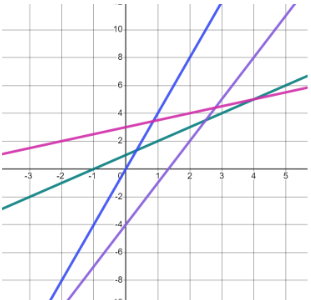
      The gradients of all 4 lines are .

      An image in a quiz
      equal
      even
      negative
      Correct answer: positive
      straight

      Q3.
      What is the gradient of this line?

      An image in a quiz
      Correct Answer: 4, four

      Q4.
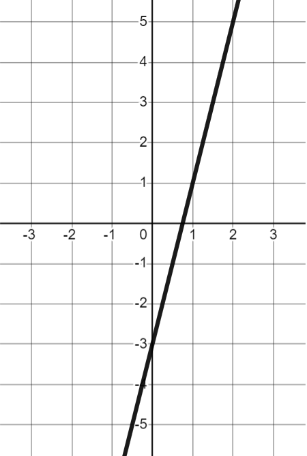
      What is the gradient of this line?

      An image in a quiz
      Correct Answer: 6, six

      Q5.
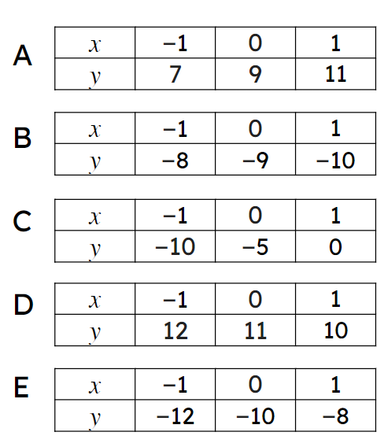
      Which of these tables of values show a relationship which will have a positive gradient when plotted?

      An image in a quiz
      Correct answer: A
      B
      Correct answer: C
      D
      Correct answer: E

      Q6.
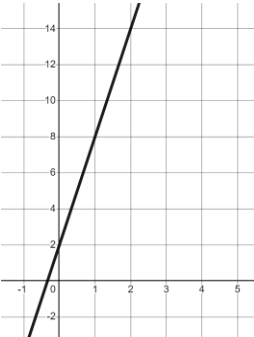
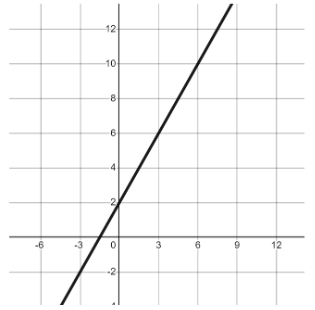
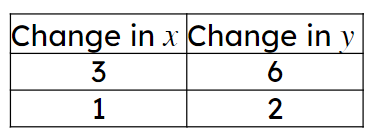
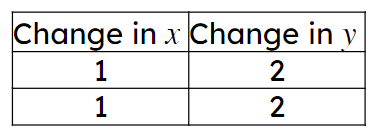
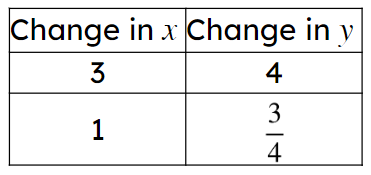
      Which is the correct ratio table for this graph?

      An image in a quiz
      An image in a quiz
      An image in a quiz
      An image in a quiz
      Correct Answer: An image in a quiz
      An image in a quiz

      6 Questions

      Q1.
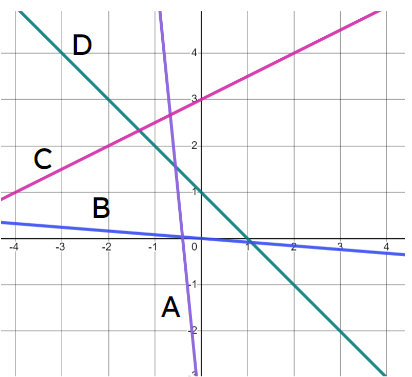
      Which of these graphs have a negative gradient?

      An image in a quiz
      Correct answer: A (purple)
      Correct answer: B (blue)
      C (pink)
      Correct answer: D (green)

      Q2.
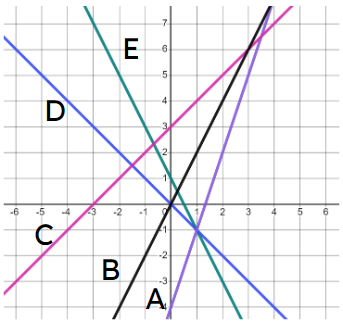
      Match the graphs to the correct gradient.

      An image in a quiz
      Correct Answer:A (purple),3
      Correct Answer:B (black),2
      Correct Answer:C (pink),1
      Correct Answer:D (blue),-1
      Correct Answer:E (green),-2

      Q3.
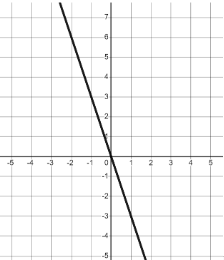
      What is the gradient of this line?

      An image in a quiz
      Correct Answer: -3, negative 3, negative three

      Q4.
      What is the gradient of this line?

      An image in a quiz
      $$-{3\over 2}$$
      Correct answer: $$-{2\over 3}$$
      $$-{1\over 2}$$
      $$2\over 3$$
      $$3\over 2$$

      Q5.
      Starting with the steepest, put these gradients in order of steepness.

      1 - $$-8$$
      2 - $$6$$
      3 - $$5\over 2$$
      4 - $$-1$$
      5 - $$-{2\over 3}$$
      6 - $$1\over 2$$

      Q6.
      Which lines would be parallel to the one shown if drawn on the same axes?

      An image in a quiz
      An image in a quiz
      Correct Answer: An image in a quiz
      An image in a quiz
      An image in a quiz
      Correct Answer: An image in a quiz
      An image in a quiz

      To help you plan your 8 maths lesson on: Negative rate of change from a graph, download all teaching resources for free and adapt to suit your pupils' needs...