Choose exam board for KS4 Computer Science (GCSE)
Choose exam board for KS4 English
Choose exam board for KS4 French
Choose exam board for KS4 Geography
Choose exam board for KS4 German
Choose exam board for KS4 History
Choose tier for KS4 Maths
Choose exam board for KS4 Music
Choose exam board for KS4 Physical education (GCSE)
Choose exam board for KS4 Religious education (GCSE)
Choose exam board for KS4 Spanish

      Calculating journeys from linear speed-time graphs
      Lesson details

      Learning outcome

      I can deduce that the area under a speed-time graph gives the distance travelled and deduce how this may be calculated.

      Key learning points

      1. Distance travelled is calculated by multiplying speed and time.
      2. This is represented on a speed-time graph by the area bound by the graph and the x axis.
      3. Calculating this area gives the total distance travelled.

      Keywords

      • Compound shape - A compound shape is a shape created using two or more basic shapes.

      Common misconception

      Calculating area by counting squares rather than looking at the scales.

      Remind pupils that often on speed-time graphs the scales on the axes will be different. Check the scales before calculating distance. Check the final answer is realistic in context.

      Teacher tip

      In lesson 5 pupils sketch distance-time from speed-time graphs. Now they can find the distance travelled at any given time they could revisit drawing distance-time graphs from linear speed-time graphs.

      Licence

      This content is © Oak National Academy Limited (2025), licensed on Open Government Licence version 3.0
      except where otherwise stated. See Oak's terms & conditions
      (Collection 2).

      Lesson video

      Loading...

      Prior knowledge starter quiz

      6 Questions

      Q1.
      Speed = __________

      speed $$\times$$ time
      time $$\times$$ distance
      speed $$\div$$ time
      Correct answer: distance $$\div$$ time
      time $$\div$$ distance

      Q2.
      Speed is the rate at which something is moving. It is measured as the distance travelled per unit of __________.

      speed
      Correct answer: time
      miles
      hours
      mph

      Q3.
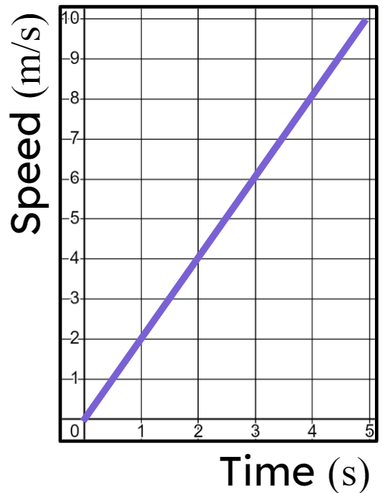
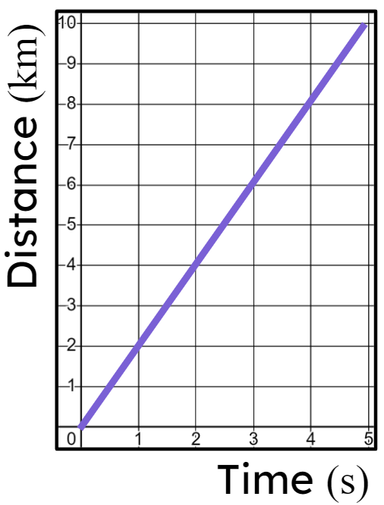
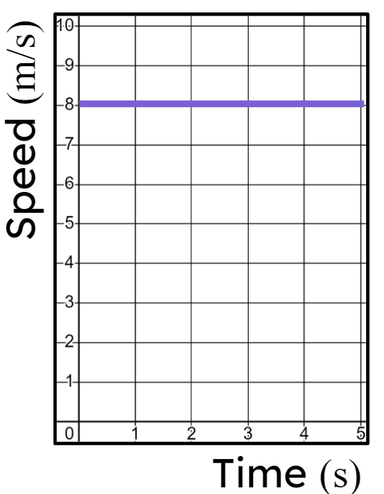
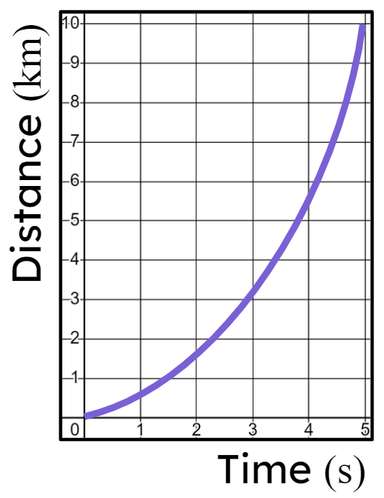
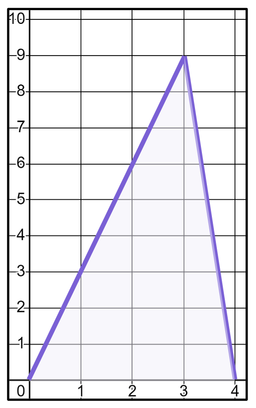
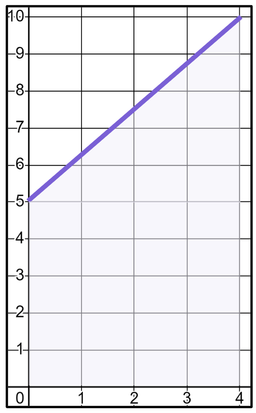
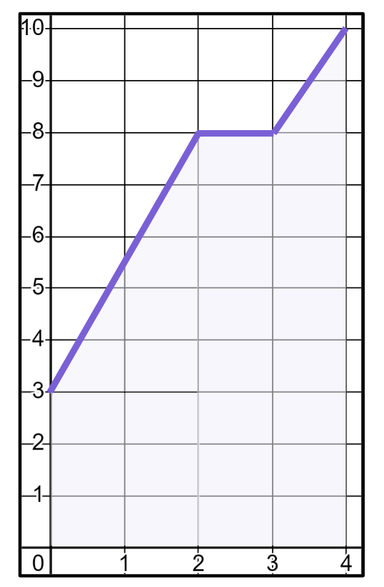
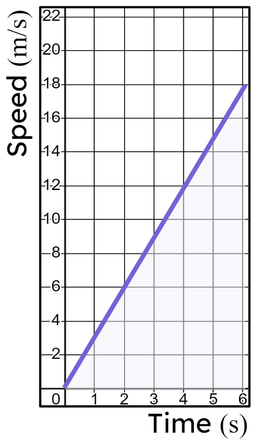
      Which of these graphs shows a constant speed?

      An image in a quiz
      Correct Answer: An image in a quiz
      An image in a quiz
      Correct Answer: An image in a quiz
      An image in a quiz
      An image in a quiz

      Q4.
      The area of the shaded shape is square units.

      An image in a quiz
      Correct Answer: 18

      Q5.
      The area of the shaded shape is square units.

      An image in a quiz
      Correct Answer: 30, A=30

      Q6.
      The area of the shaded shape is square units.

      An image in a quiz
      Correct Answer: 28

      6 Questions

      Q1.
      On a speed-time graph the __________ bound by the graph and horizontal axis tells us the distance travelled.

      length
      distance
      Correct answer: area
      speed
      volume

      Q2.
      Which calculation would find how far is travelled between $$0$$ and $$4$$ seconds?

      An image in a quiz
      $$4\times12=48$$ metres
      $$6\times18=108$$ metres
      Correct answer: $${1\over2}\times4\times12=24$$ metres
      $${1\over2}\times6\times18=54$$ metres
      $$12$$ metres

      Q3.
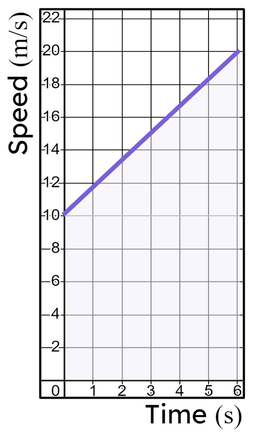
      Calculate how far the particle travelled between $$4$$ and $$6$$ seconds.

      An image in a quiz
      Correct Answer: 30 metres, 30

      Q4.
      How far has the particle modelled in this graph travelled after $$6$$ seconds? metres.

      An image in a quiz
      Correct Answer: 90

      Q5.
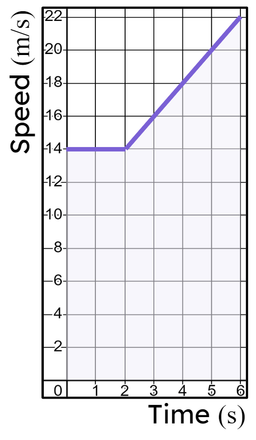
      How far has the particle modelled in this graph travelled between $$0$$ and $$3$$ seconds?

      An image in a quiz
      Half the whole area under the graph up to $$6$$ seconds.
      $${{1\over2}(10+16)\times{3}}$$ metres
      Correct answer: $$(2\times14)+\left({{1\over2}(14+16)\times{1}}\right)$$ metres
      $$(2\times14)+\left({{1\over2}(14+16)\times{3}}\right)$$ metres
      $$(3\times14)+\left(\frac{1}{2}\right)$$ metres

      Q6.
      How far has the particle modelled in this graph travelled after $$6$$ seconds? metres.

      An image in a quiz
      Correct Answer: 100

      To help you plan your 11 maths lesson on: Calculating journeys from linear speed-time graphs, download all teaching resources for free and adapt to suit your pupils' needs...