


New
New
Examining our geographical data
I can answer my enquiry question using the data I have collected and presented.


Lesson 5 of 6
New
New
- Year 5
Examining our geographical data
I can answer my enquiry question using the data I have collected and presented.
Lesson details
Key learning points
- Geographers can compare the total scores for different sites to decide on the best location for something.
- Geographers can compare the scores for different categories to understand where there are strengths and weaknesses.
- Geographers use all their data to answer their enquiry question.
Keywords
Compare - to look at data to see where there are similarities and differences
Summarise - to bring all the key information together at the end of the enquiry
Hypothesis - a prediction that geographers make about the results of their enquiry
Common misconception
Geographers are only concerned with the data that shows the maximum scores.
Geographers do often use the maximum scores to show the best option, but they also look within the data to see how some variables compare with others.
Where geographical data offers a number of options, teachers can introduce a voting system where the whole class gets to decide on the final conclusion.

Teacher tip

Equipment

Content guidance
- Risk assessment required - outdoor learning

Supervision
Adult supervision required

Licence
This content is © Oak National Academy Limited (2026), licensed on Open Government Licence version 3.0 except where otherwise stated. See Oak's terms & conditions (Collection 2).
Lesson video
Loading...
Prior knowledge starter quiz
6 Questions
Q1.Data that is drawn on a map is known as data.
Data that is drawn on a map is known as data.

Q2.What happens after we present data?
What happens after we present data?
We collect more data.
We evaluate our enquiry.
We write our hypothesis.
Q3.Which piece of equipment is essential for drawing bar charts?
Which piece of equipment is essential for drawing bar charts?
a compass
a glue stick
a trundle wheel
Q4.Maps and bar charts both have …
Maps and bar charts both have …
3 x 3 grids.
a bottom axis.
more than one scale.
Q5.How do our 3 x 3 grids on our map help us reflect on our data?
How do our 3 x 3 grids on our map help us reflect on our data?
They make the map more attractive to read.
They give us a score out of 10.
They make the data fair.
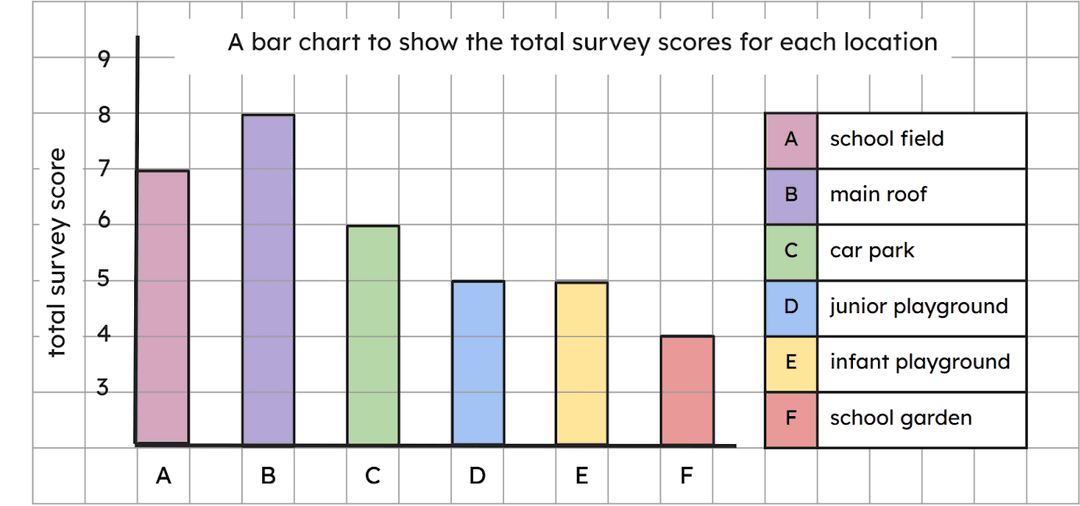
Q6.On our bar chart, the bottom is marked with the six different locations.
On our bar chart, the bottom is marked with the six different locations.
Assessment exit quiz
4 Questions
Q1.If we look at data to find similarities and differences, we are …
If we look at data to find similarities and differences, we are …
summarising.
collecting.
presenting.
Q2.Which of the following statements is true?
Which of the following statements is true?
Geographers only look closely at the highest scores in a data set.
Geographers only look closely at the lowest scores in a data set.
Geographers examine the data that is the same as their hypothesis.
Q3.Which of the following would not give us detailed data about our enquiry?
Which of the following would not give us detailed data about our enquiry?
a completed score table
a bar chart presenting the data
Q4.Which of these is the right order in which to write a conclusion?
Which of these is the right order in which to write a conclusion?
answer the question; address hypotheses; summarise the findings
summarise the findings; address hypotheses; answer the question
address hypotheses; summarise the findings; answer the question
