


New
New
Interpret the scales used in graphs, including pie charts, to solve problems
I can solve problems using line graphs and pie charts.


Lesson 5 of 5
New
New
- Year 6
Interpret the scales used in graphs, including pie charts, to solve problems
I can solve problems using line graphs and pie charts.
Lesson details
Key learning points
- A pie chart represents parts of a whole.
- A line graph represents the relationship between two variables.
- Place value helps you to interpret partially marked scales and axes.
Keywords
Line graph - A line graph is a graph where the points are connected by lines.
Pie chart - A pie chart is a circular graph where sectors represent different groups in proportion to each other.
Sector - A sector is a part, or ‘pie-slice’ part, of a pie chart.
Common misconception
Pupils may make errors interpreting information from pie charts, especially with making links between angles, fractions, percentages and working out an answer to a question.
Display 'benchmarks' in the classroom, showing a pie chart with labelled sectors (e.g. showing that 10% is equal to one tenth or 36° of the chart; 25% is equal to one quarter or 90°).
Pupils need to have some familiarity with both line graphs and pie charts before this session. Give the pupils a chance to talk about the graphs too, making observations and asking questions (e.g. 'Why wasn't Izzy running here?' or 'The pie chart shows that Jacob scored the most points.')

Teacher tip

Equipment

Licence
This content is © Oak National Academy Limited (2025), licensed on Open Government Licence version 3.0 except where otherwise stated. See Oak's terms & conditions (Collection 2).
Lesson video
Loading...
Prior knowledge starter quiz
6 Questions
Q1.The line graph shows how the temperature changes between the hours of 8 am and 7 pm. Estimate the temperature at 9:30 am. °C
The line graph shows how the temperature changes between the hours of 8 am and 7 pm. Estimate the temperature at 9:30 am. °C


Q2.This line graph shows how Izzy’s height has changed as she has grown. At what age would Izzy have been 110 cm tall?
This line graph shows how Izzy’s height has changed as she has grown. At what age would Izzy have been 110 cm tall?

Q3.This line graph shows Sam’s height from birth. Estimate Sam’s height at age 3 years.
This line graph shows Sam’s height from birth. Estimate Sam’s height at age 3 years.

90 cm
95 cm
100 cm
Q4.The line graph shows the children’s journeys from school. At what time does Izzy leave home?
The line graph shows the children’s journeys from school. At what time does Izzy leave home?

8:15 am
8:35 am
Q5.Which child’s journey takes the longest time?
Which child’s journey takes the longest time?
Izzy
Sofia
Q6.The pie chart shows children's lunch choices. Which of these statements are correct?
The pie chart shows children's lunch choices. Which of these statements are correct?
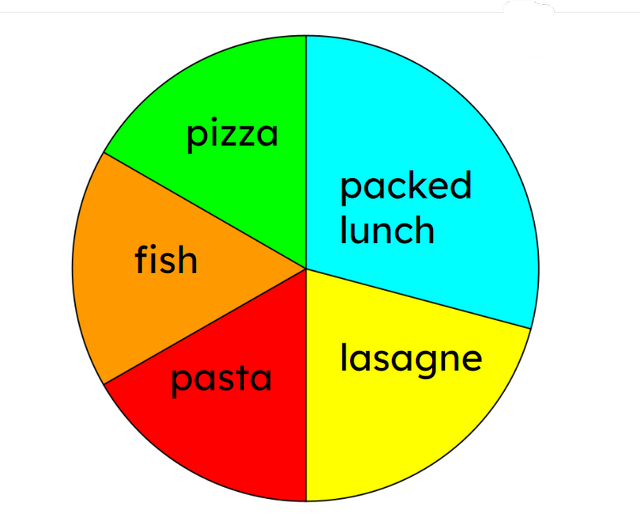
The same number of children chose packed lunch as pizza.
Lasagne was the least popular choice.
Assessment exit quiz
6 Questions
Q1.Andeep took part in the 800 m race. Estimate the time it took him to complete it.
Andeep took part in the 800 m race. Estimate the time it took him to complete it.

5 minutes and 30 seconds
5 minutes and 55 seconds
6 minutes
Q2.Andeep took part in an obstacle race including three challenges where he had to stop and complete a task. Estimate how long it took for him to reach the third challenge.
Andeep took part in an obstacle race including three challenges where he had to stop and complete a task. Estimate how long it took for him to reach the third challenge.

35 seconds
40 secods
Q3.At what time did Izzy catch up with Andeep during the race? seconds.
At what time did Izzy catch up with Andeep during the race? seconds.

Q4.The children were taking part in a skipping challenge at Sports Day. Altogether they scored 160 points. How many points did Andeep score? points.
The children were taking part in a skipping challenge at Sports Day. Altogether they scored 160 points. How many points did Andeep score? points.

Q5.The pie chart shows the number of points scored in a bean bag competition at Sports Day. The total number of points scored was 280; Sofia scored 40% of the points. How many points did Jun score?
The pie chart shows the number of points scored in a bean bag competition at Sports Day. The total number of points scored was 280; Sofia scored 40% of the points. How many points did Jun score?

Q6.The pie chart shows the number of points scored in a bean bag competition at Sports Day. The total number of points scored was 280; Sofia scored 40% of the points. How many points did Alex score?
The pie chart shows the number of points scored in a bean bag competition at Sports Day. The total number of points scored was 280; Sofia scored 40% of the points. How many points did Alex score?
