Interpreting and drawing real-life graphs
I can interpret and draw other real-life graphs.


- Year 11
Interpreting and drawing real-life graphs
I can interpret and draw other real-life graphs.
Lesson details
Key learning points
- Not all real-life graphs can be drawn using sections of different linear graphs.
- The graphs are models, which means that we want them to be useful.
- Different containers may need different graphs to model filling them.
- Volume of liquid changes over time and this is affected by container shape.
Keywords
Time series graphs - Time series graphs show data over a time period. The time period is always shown on the $$x$$-axis. Data points are joined chronologically by line segments.
Extrapolation - Extrapolation is the process of estimating unknown values that are outside the range of existing data.
Interpolation - Interpolation is the process of estimating unknown values that are inside the range of existing data.
Common misconception
Interpolation is always more accurate than extrapolation.
If a graph is plotting data collected at set points then there is no way to know what is happening between the points. The trend between the points could be a curve, a line or could fluctuate. Interpolation could therefore be inaccurate.


Licence
Lesson video
Loading...
Prior knowledge starter quiz
6 Questions
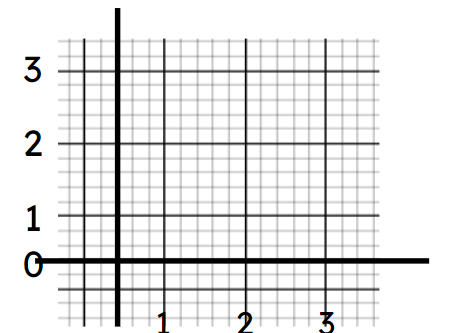
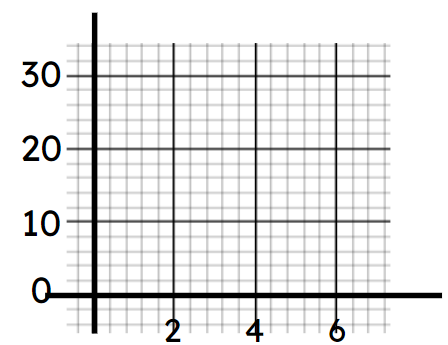
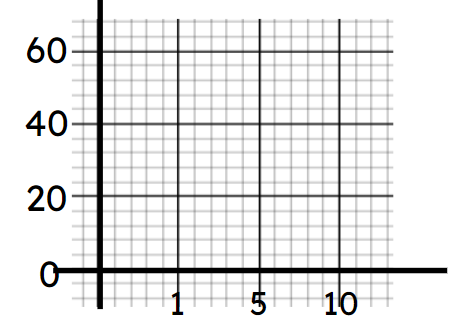
Q1.Which of these axes are correctly drawn?

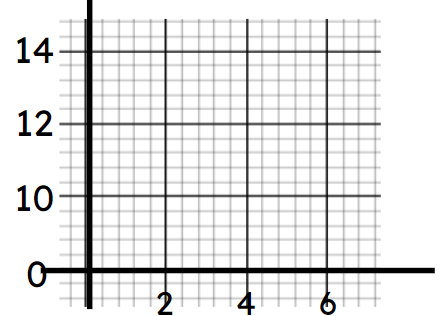
Q2.__________ is the process of estimating unknown values that are outside the range of existing data.
Q3.__________ is the process of estimating unknown values that are inside the range of existing data.
Q4.Which of these could be units of volume?
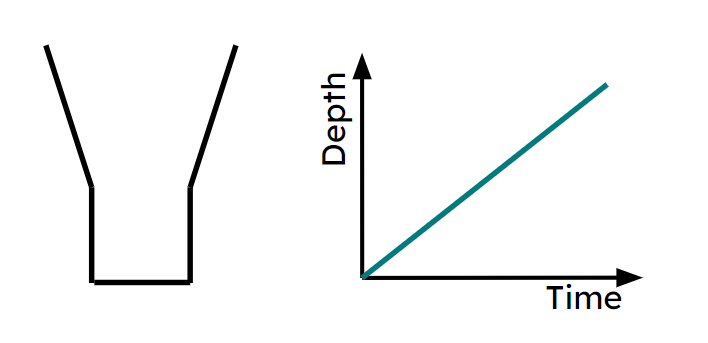
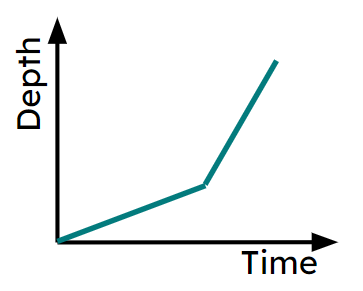
Q5.This is the cross section of a container. If it was filled at a constant rate, which of these would be its depth-time graph?

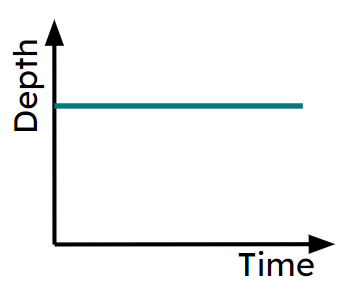
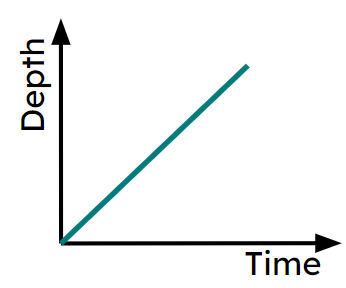
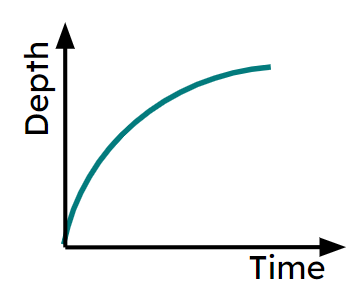
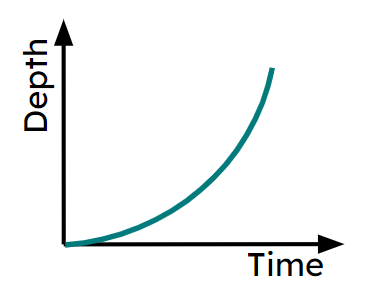
Q6.This is the cross-section of a container. If it was filled at a constant rate, which of these would be its depth-time graph?

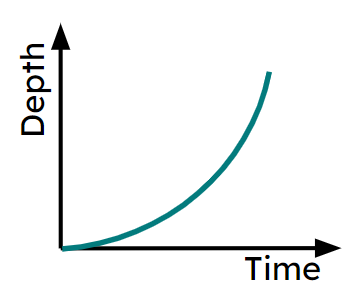
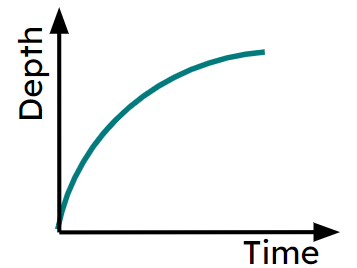
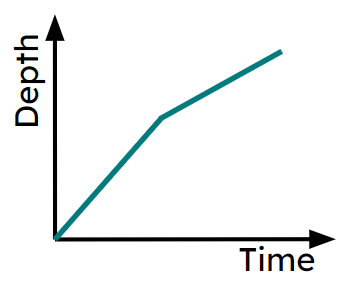
Assessment exit quiz
6 Questions
Q1.On a time series graph, data points are joined chronologically by __________.
Q2.Why can it be inaccurate to interpolate from a time series graph?
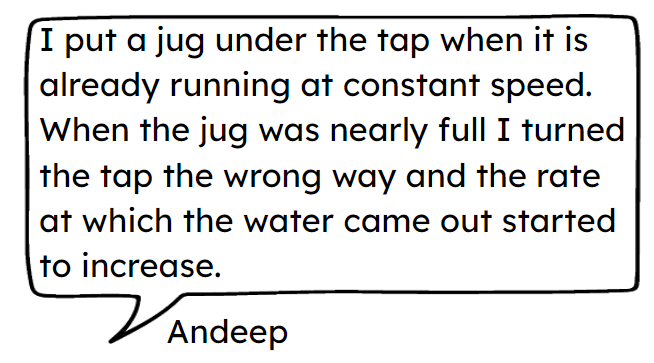
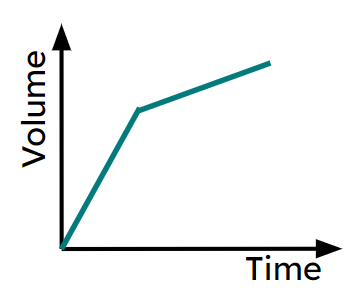
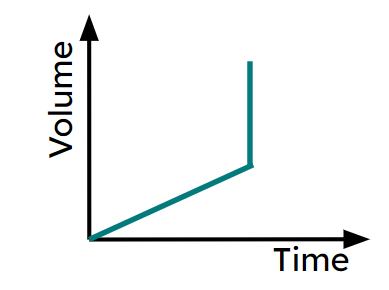
Q3.Which graph would match Andeep's scenario?
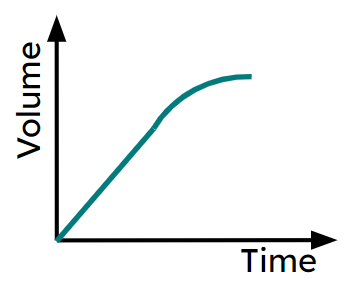
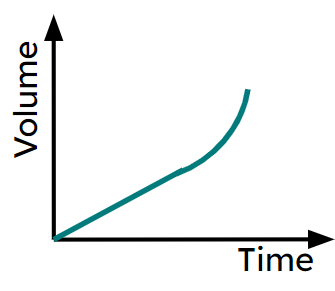
Q4.This container is filled at a constant rate. Which graph could model this scenario?
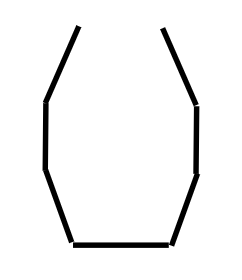
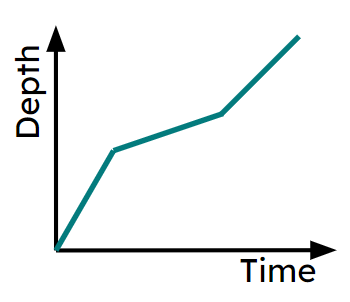
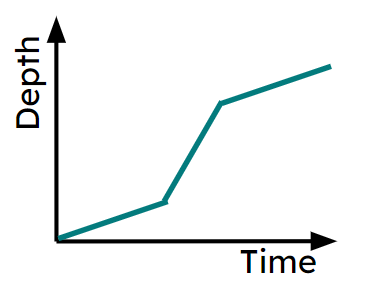
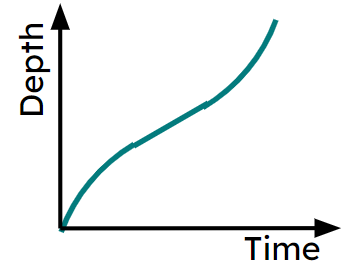
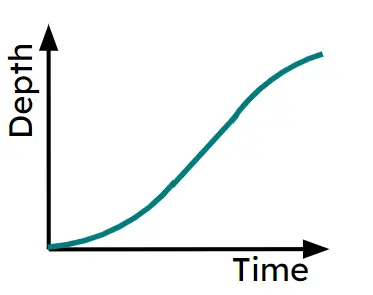
Q5.This container is filled at a constant rate. Which graphs could model this scenario?

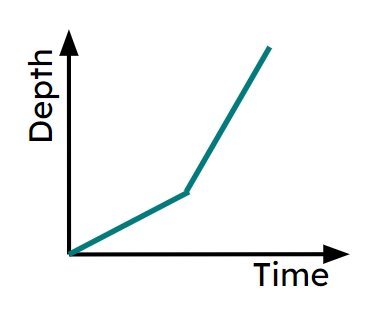
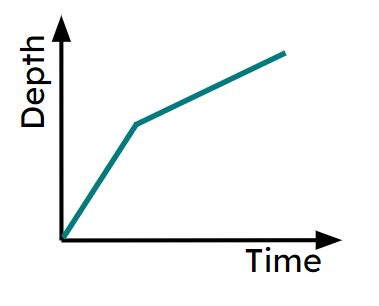
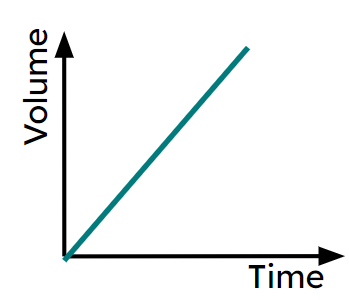
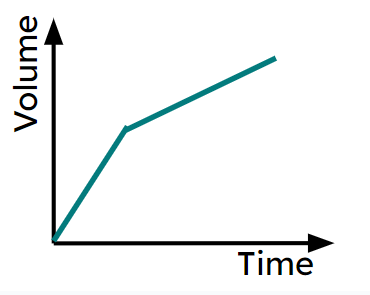
Q6.Aisha is filling this container with water. What must be the case for this depth-time graph to be accurate?