New
New
Interpreting time series graphs
I can interpret time series graphs, including commenting on trends.
Lesson 7 of 8
New
New
- Year 10
Interpreting time series graphs
I can interpret time series graphs, including commenting on trends.
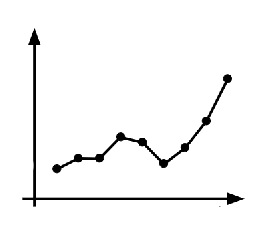
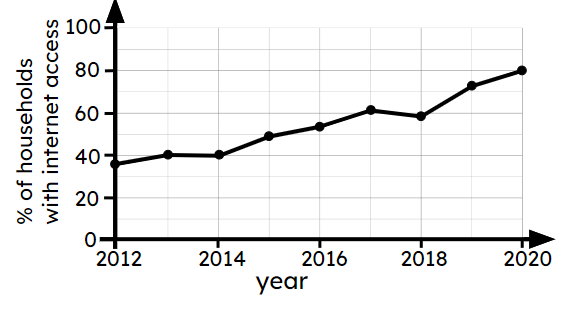
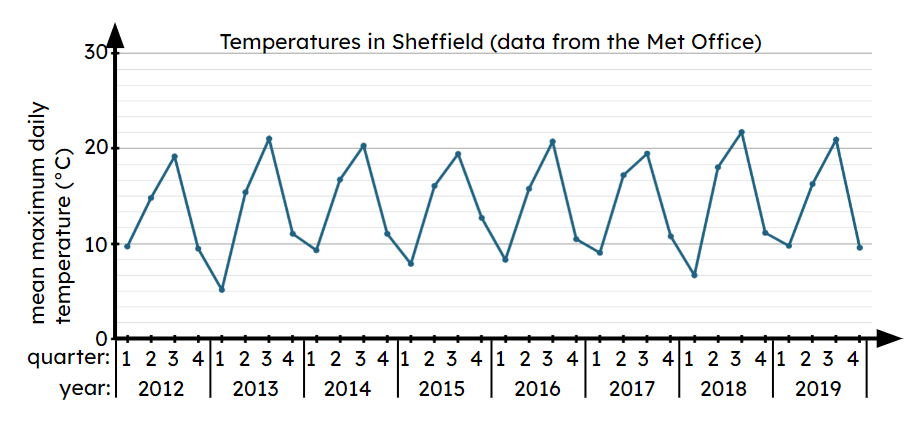
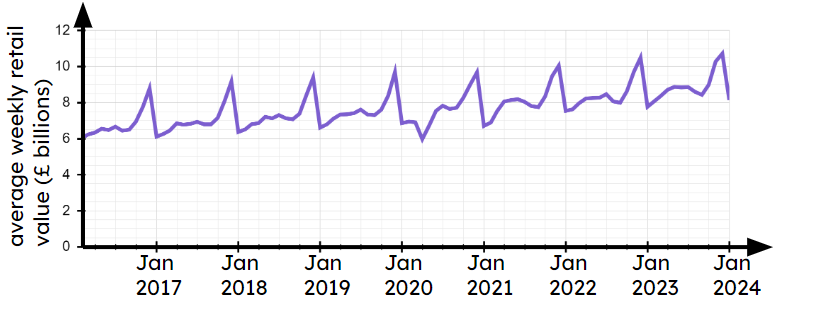
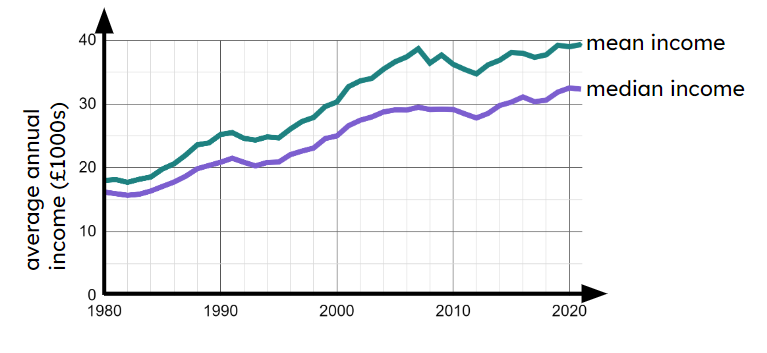
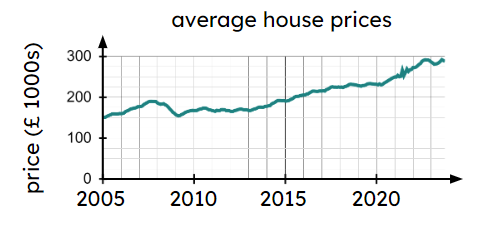
Time series graphs - Time series graphs show data over a time period. The time period is always shown on the x-axis. Data points are joined chronologically by line segments.
Pupils may place too much confidence in the accuracy of predictions based on extrapolating time series graphs into the future.
While extrapolating a time series graph provide an indication of what future results may be, predictions are not guaranteed. Context should also be considered in these cases (e.g. whether there is a natural limit to how high a variable may reach).