- Year 11
Non-linear distance-time graphs
I can interpret non-linear distance-time graphs.
Lesson details
Key learning points
- Speed may not always be constant.
- Acceleration may not always be constant.
- Depending on the variables, multiple graphs can represent the same journey.
Keywords
Speed - Speed is the rate at which something is moving. It is measured as the distance travelled per unit of time.
Acceleration - Acceleration is the rate of change of speed with respect to time.
Deceleration - Deceleration is the rate at which the speed of an object is decreasing.
Common misconception
Pupils may think a horizontal line on a speed-time means the object is stationary.
The $$y$$ axis is plotting speed so a horizontal line means the speed has not changed in that time. But this can be at any speed. Pupils need to double check axes to know what sort of graph they are using.


Licence
Lesson video
Loading...
Prior knowledge starter quiz
6 Questions
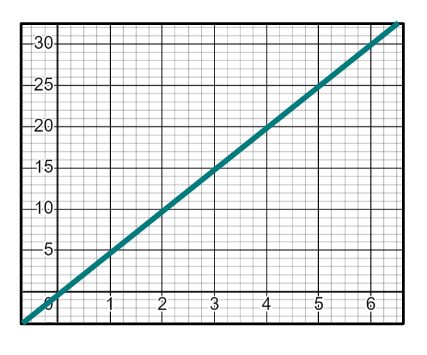
Q1.The gradient of this line is .

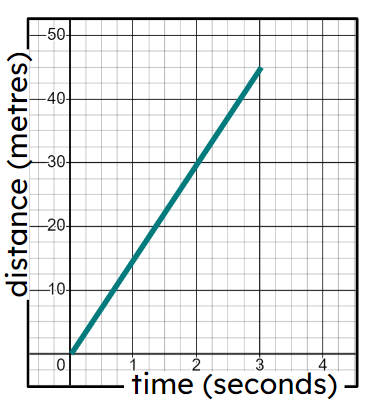
Q2.This distance-time graph shows an object moving at constant speed. The object is travelling at m/s.
Q3.Which of these represents constant non-zero speed?
Q4.What does a line segment with negative gradient represent on a speed-time graph?
Q5.The speed-time graph shows the first 20 seconds of an object's journey. How long was the object stationary during this time?
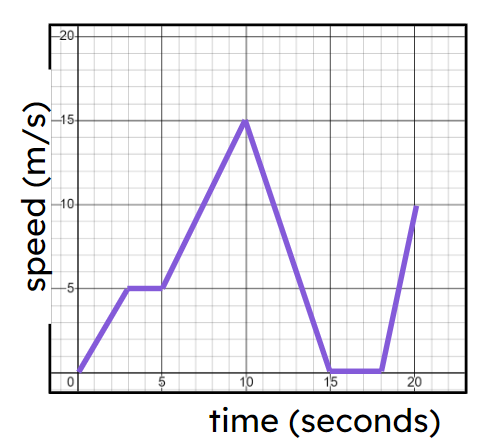
Q6.The speed-time graph shows the first 20 seconds of an object's journey. How long was the object decelerating for?
Assessment exit quiz
6 Questions
Q1.This distance-time graph shows the journey of an object. Match up the stages of the graph labelled a)-e) with the stages of the journey.
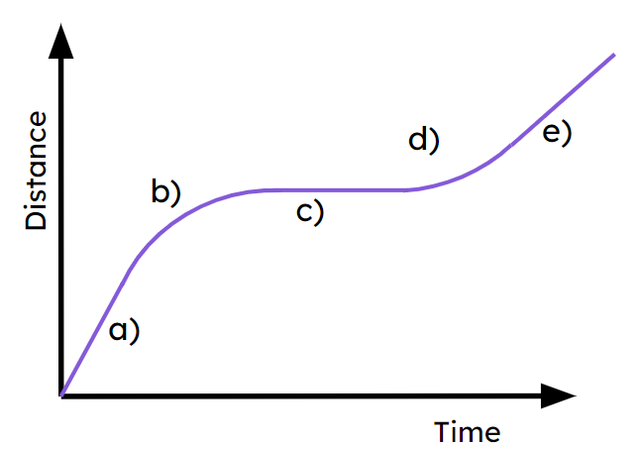
a) - Fastest constant speed
b) - Object decelerating
c) - Object stationary
d) - Object's speed is increasing
e) - Slowest section of (non-zero) constant speed
Q2.Which of these is the correct distance-time graph for the journey shown on this speed-time graph?
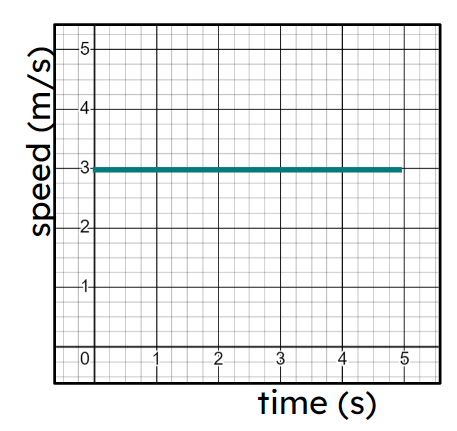
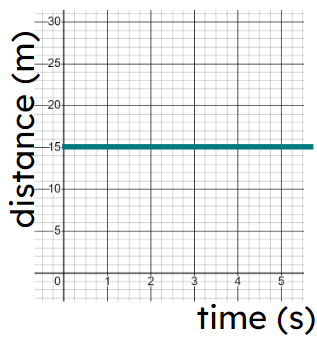
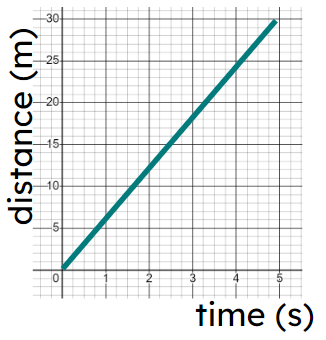
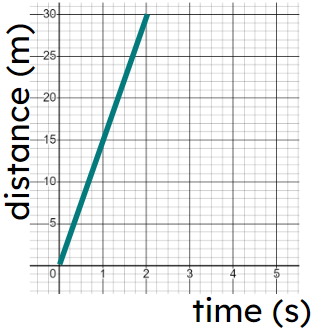
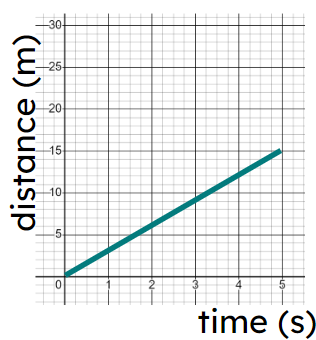
Q3.Which of these is the correct speed-time graph for the journey shown on this distance-time graph?
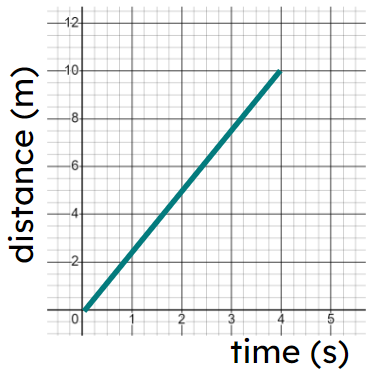
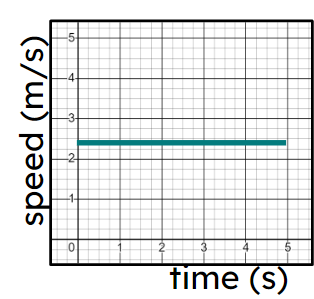
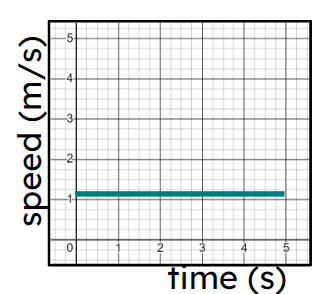
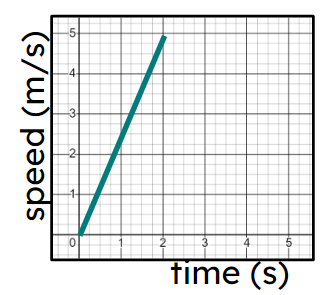
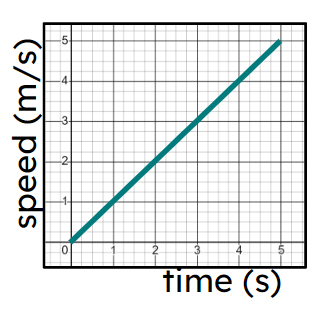
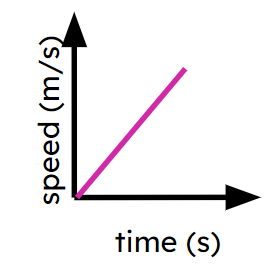
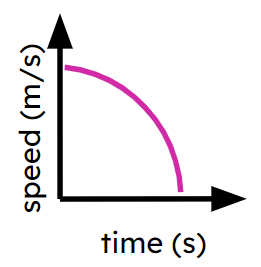
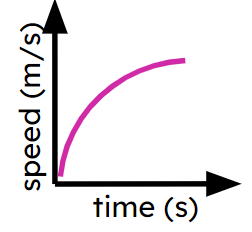
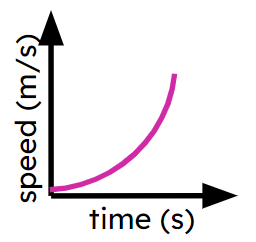
Q4.Which of these graphs could show an object decelerating until stopped?
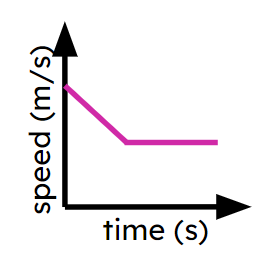
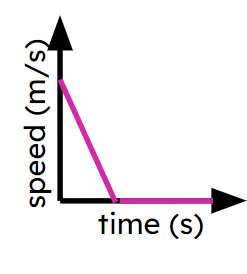
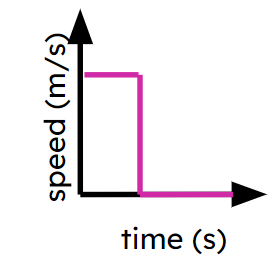
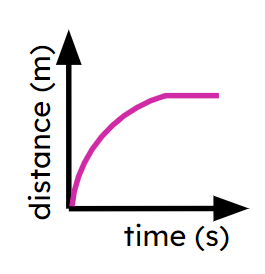
Q5.Which speed-time graph could show the same journey as this distance-time graph?
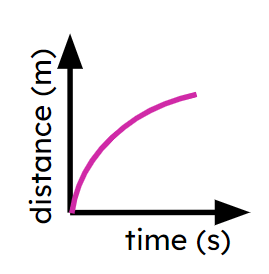
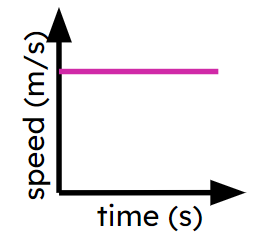
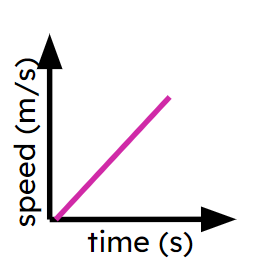
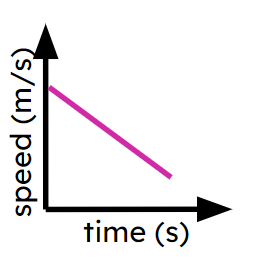
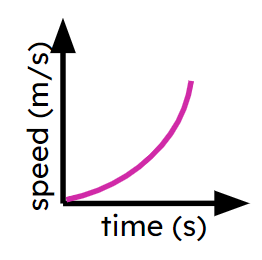
Q6.Which of these graphs show speed increasing (positive acceleration)?