


New
New
Presenting our geographical data
I can present data in a way that will help me answer my enquiry question.


Lesson 4 of 6
New
New
- Year 5
Presenting our geographical data
I can present data in a way that will help me answer my enquiry question.
Lesson details
Key learning points
- Data that we collect in fieldwork can be presented in different ways.
- Maps can be used to show data that is about the differences between places.
- Graphs can help us to see patterns in our data.
Keywords
Bar chart - a graphic that allows geographers to compare data values
Key - a section of the map that tells the reader what symbols and colours mean
Geolocated data - data that is drawn on a map in the position where that data was collected
Common misconception
Maps are only used to help us find out where places are.
Maps are a brilliant tool that geographers can use to record and present information as well as use for navigation.
If this is the first time pupils have presented data on a map, consider making it a whole class activity using a large map on a wall as the base map for the data. Equally, groups of pupils could work together on large A3 maps of the school grounds.

Teacher tip

Equipment
graph paper; A3 or large maps of the school grounds; scissors; glue

Content guidance
- Risk assessment required - outdoor learning

Supervision
Adult supervision required

Licence
This content is © Oak National Academy Limited (2026), licensed on Open Government Licence version 3.0 except where otherwise stated. See Oak's terms & conditions (Collection 2).
Lesson video
Loading...
Prior knowledge starter quiz
6 Questions
Q1.What is a variable?
What is a variable?

a prediction about what the results will be like
a summary of the main findings from the enquiry
a fieldwork location
Q2.What happens after we collect data in the enquiry cycle?
What happens after we collect data in the enquiry cycle?
We reflect on the data.
We answer our enquiry question.
We evaluate our enquiry.
Q3.Which of these would help us compare one fieldwork location with others?
Which of these would help us compare one fieldwork location with others?
measure different things in each location.
only measure two locations.
Q4.What is biased data?
What is biased data?
data that has been collected accurately
data that only uses numbers such as scores
data that is collected by observing rather than measuring
Q5.Why might some data be hard to collect?
Why might some data be hard to collect?
It might be biased.
It might be in words rather than numbers.
We might have too many people helping us.
Q6.How can we try to make sure our data has less bias?
How can we try to make sure our data has less bias?
We can avoid collecting data that is scores.
We can reduce the number of places we collect data.
We can only record one person’s score.
Assessment exit quiz
4 Questions
Q1.What is a key?
What is a key?
a line that shows the edges of the map
a symbol that shows which way up the map should be
a sentence that says what the map is showing
Q2.Which of the following statements is true?
Which of the following statements is true?
Maps should only be used for navigation.
Maps should only be used for presenting information.
Maps are drawn to show the beauty of a place.
Q3.What would a bar chart of our results show in each location?
What would a bar chart of our results show in each location?
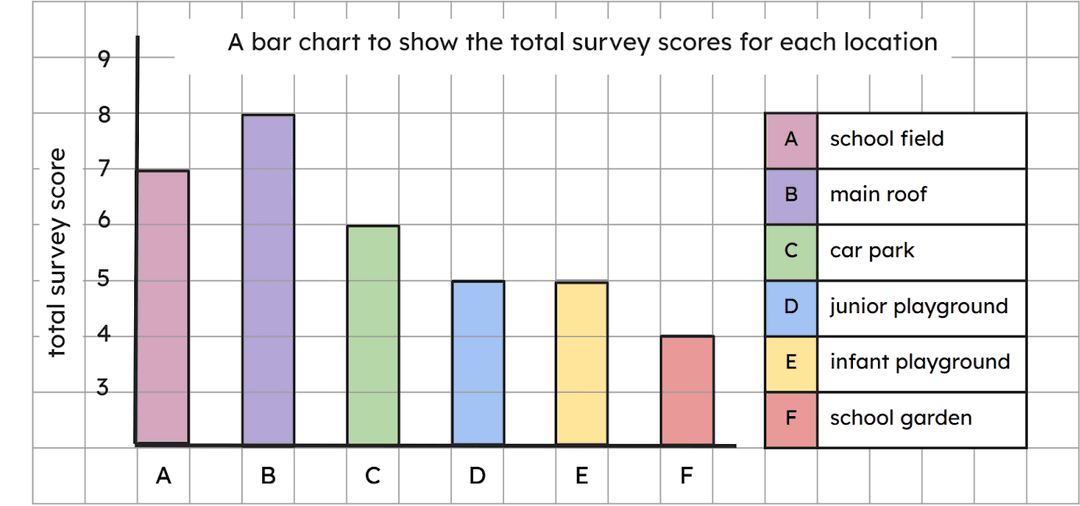
the size of the area at that location.
how sunny that location was.
the height of the land at that location.
Q4.Why did we use 3 x 3 grids on our map?
Why did we use 3 x 3 grids on our map?
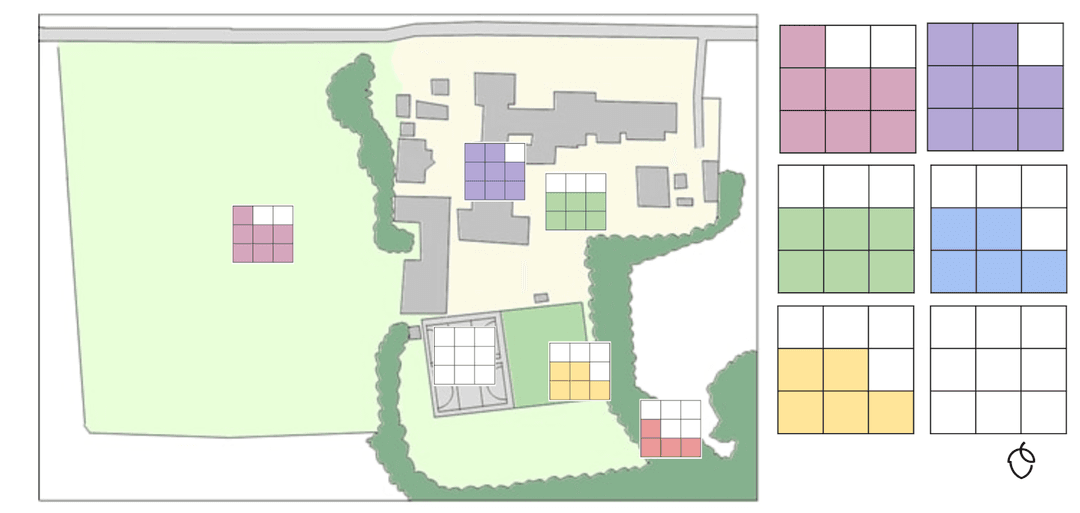
to make the map look pretty
to show the area of each location
to allow readers to identify each location
