


Using the fx-CG50 for statistics
I can use the fx-CG50 to perform calculations with data.


- Year 9
Using the fx-CG50 for statistics
I can use the fx-CG50 to perform calculations with data.
Lesson details
Key learning points
- Some calculators can perform more than just basic calculations.
- The fx-CG50 can produce a statistical summary of a set of data.
- The summary includes the mean, median, upper and lower quartiles.
- The fx-CG50 can produce graphical representations of data.
Keywords
Frequency - The frequency is the number of times an event occurs; or the number of individuals (people, animals etc.) with some specific property.
Mean - The (arithmetic) mean for a set of numerical data is the sum of the values divided by the number of values. It is a measure of central tendency representing the average of the values.
Median - The median is the central (middle) piece of data when the data are in numerical order. It is a measure of central tendency representing the average of the values.
Mode - The mode is the most frequent value. It is a measure of central tendency representing the average of the values.
Statistical summary - A statistical summary sums up the features of a data set. It may contain the mean, median and/or mode which measure the central tendency. It may also contain the range which measures the spread.
Common misconception
Calculators can only be used to add, subtract, multiply or divide.
They can be used to perform basic calculations but they can also do so much more.


Equipment
Casio fx-CG50

Licence
Lesson video
Loading...
Prior knowledge starter quiz
6 Questions
Q1.The is the number of times an event occurs; or the number of individuals (people, animals etc.) with some specific property.

Q2.The arithmetic for a set of numerical data is the sum of the values divided by the number of values. It is a measure of central tendency representing the average of the values.
Q3.The is the central (middle) piece of data when the data are in numerical order. It is a measure of central tendency representing the average of the values.
Q4.The is the most frequent value. It is a measure of central tendency representing the average of the values.
Q5.A summary sums up the features of a data set. It may contain the mean, median and/or mode which measure the central tendency. It may also contain the range which measures the spread.
Q6.Calculate the mean of this data: 3, 3, 3, 4, 4, 5, 5, 7, 7, 7, 7, 7, 7, 8, 9, 12, 15. Give your answer to 2 d.p.
Assessment exit quiz
6 Questions
Q1.This frequency table shows the star rating received by a restaurant over its opening weekend. What was the mean star rating (to the nearest star)?
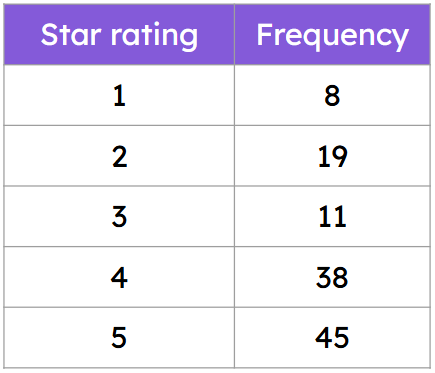
Q2.This frequency table shows the star rating received by a restaurant over its opening weekend. What was the median star rating?
Q3.This frequency table shows the star rating received by a restaurant over its opening weekend. Calculate the interquartile range.
Q4.The time it takes for a sample of pupils to travel to school is collected in this grouped frequency table. What is the estimated mean travel time (to the nearest minute)?
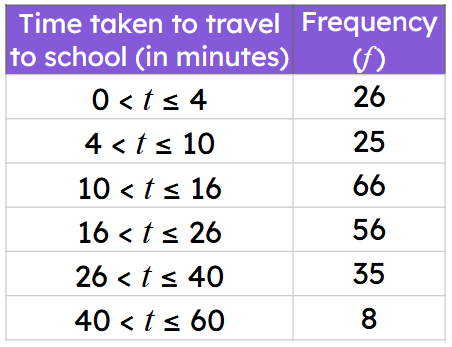
Q5.The time it takes for a sample of pupils to travel to school is collected in this grouped frequency table. In what time interval is the median?
Q6.The time it takes for a sample of pupils to travel to school is collected in this grouped frequency table. Calculate the estimated interquartile range.
