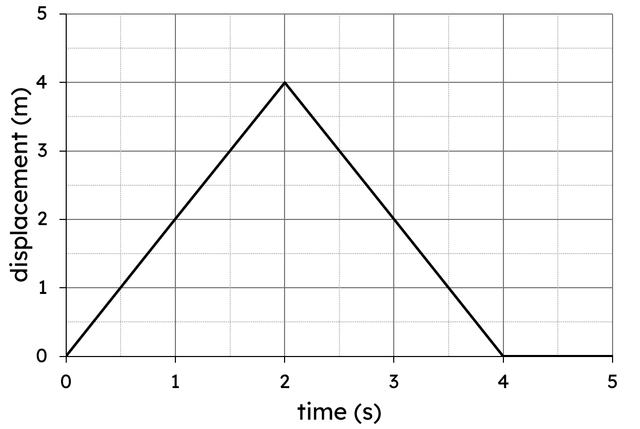
Velocity on a graph (v = s ÷ t)
I can sketch accurate displacement-time graphs of different motions.


- Year 10
- AQA
Velocity on a graph (v = s ÷ t)
I can sketch accurate displacement-time graphs of different motions.
Lesson details
Key learning points
- The velocity of an object is equal to the gradient of a displacement-time graph.
- A direction in which velocity and displacement are measured needs to be chosen.
- A negative gradient on a displacement-time graph (sloping downwards) represents velocity in the opposite direction.
- A negative value for displacement represents a position ‘behind’ the starting position.
Keywords
Displacement - The displacement of an object is the distance and direction from a specific point. Displacement is a vector.
Displacement-time graph - A displacement-time graph shows the displacement of an object over a period of time.
Motion sensor - A motion sensor measures the distance between itself and an object. We can use the measurements to calculate and plot graphs of displacement, velocity and acceleration.
Common misconception
Negative values on a displacement-time graph always represent motion that is backwards.
Provide opportunities for pupils to plot a range of displacement-time graphs in real time in order for them to understand how the graph represents different motions.


Equipment
See additional materials.

Content guidance
- Risk assessment required - equipment

Supervision
Adult supervision required

Licence
Lesson video
Loading...
Prior knowledge starter quiz
6 Questions
Q1.Some swimmers compete in a 50m race. Their times are shown.
Starting with the fastest, sort the swimmers in order of their speeds.

Q2.Which of the following are vector quantities?
Q3.A rocket has a velocity of 200 m/s upwards.
What distance will the rocket travel upwards in 30 s?
Q4.A jogger runs for 250 s and they end up 625 m west of their starting point.
Calculate the average velocity of the jogger.
Q5.Two trains are travelling in the same direction. Train A has a speed of 6.5 m/s and train B has a speed of 5.5 m/s. What is the relative speed of the two trains?
Q6.An small airplane travels 45 km north in 30 minutes.
Calculate the average velocity of the airplane in m/s.

Assessment exit quiz
6 Questions
Q1.Match the key word or phrase to the explanation.

Q2.Which feature of a displacement-time graph shows the velocity?
Q3.An ultrasonic motion sensor is used to measure displacement of a ball. Put each step in order to explain how the sensor works.
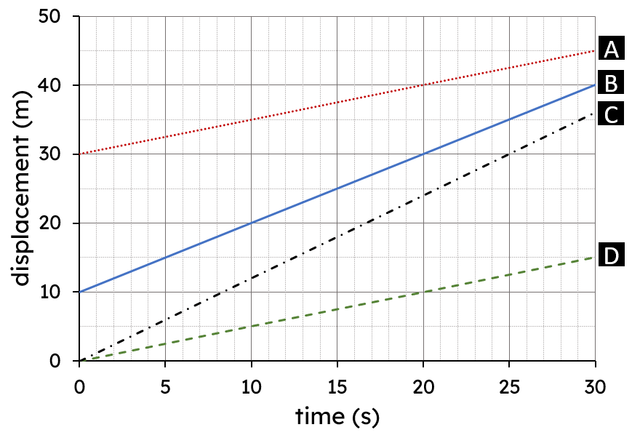
Q4.Which line on the graph show the highest velocity?
Q5.Select the options which describe the motion between 1 s and 5 s.

Q6.A pupil has plotted a graph to show their movement as they run across the classroom. Why is this graph unrealistic?