


Statistical problems - drawing conclusions


Lesson details
Learning outcome
I can effectively summarise and communicate conclusions to a statistical problem.
Key learning points
- Conclusions can be drawn from statistical summaries and graphical representations.
- Conclusions are understood to be limited by any biases.
- Conclusions are understood to only be valid for this sample of data.
Keywords
Population - The population is the entire set of people, creatures, plants or items that make up the whole group which is being studied
Sample - A sample is a subset of the population.
Bias - Bias can be present in any sample collected from a population. e.g. only asking year 7 pupils about a whole school issue.
Statistical summary - A statistical summary sums up the features of a data set
Common misconception
The findings for a data investigation using a sample can always be generalised to the population.
The generalisability of results can depend on how representative the sample is of the population which it is being compared to.
Teacher tip
Ask pupils to consider different scenarios where the results of a data investigation may differ depending the age of the sample - E.g., hours of sleep per night, number of cartoons watched per day, method of travelling to school/work.

Licence

Lesson video
Loading...
Prior knowledge starter quiz
6 Questions
Q1.In a data investigation, the __________ is the entire set of people, creatures, plants or items that make up the whole group which is being studied.
Q2. is the relationship between two variables on a scatter graph.
Q3.Extrapolation is the process of estimating unknown values that are .
Q4.What type of correlation does the scatter graph show?
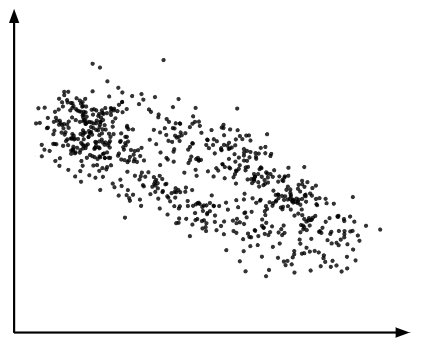
Q5.A data investigation finds a positive correlation between temperature and ice cream sales. What does this suggest?
Q6.The mean for the following numbers data set 8.2, 7.4, 11.3, 9.1 is .
Assessment exit quiz
6 Questions
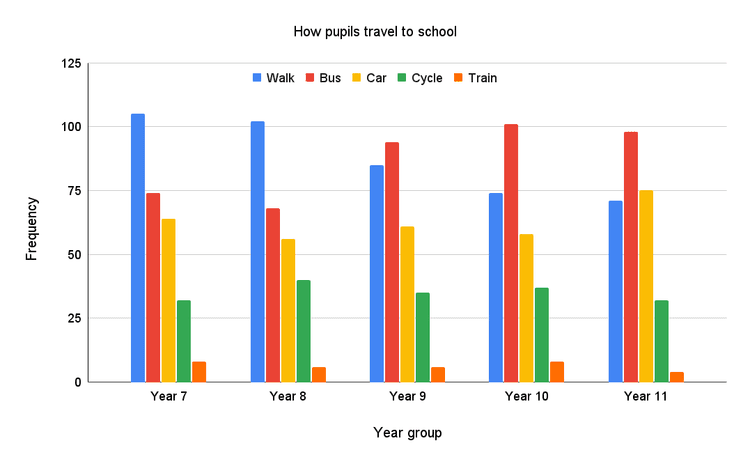
Q1.Which is the least popular mode of transport in this school?
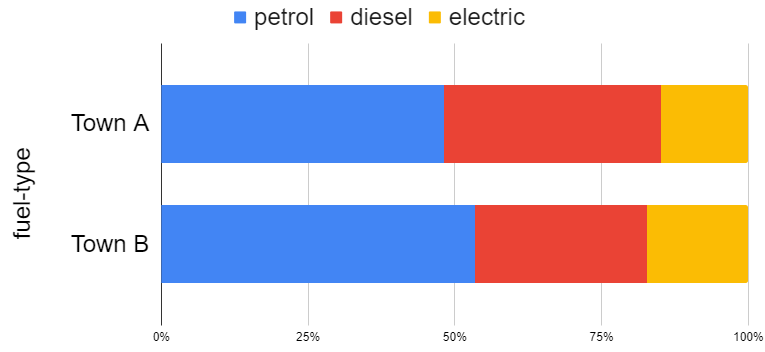
Q2.An investigation surveys residents of two towns about which type of car they drive. The stacked bar chart shows the results. Which is the most popular type of car in this survey?
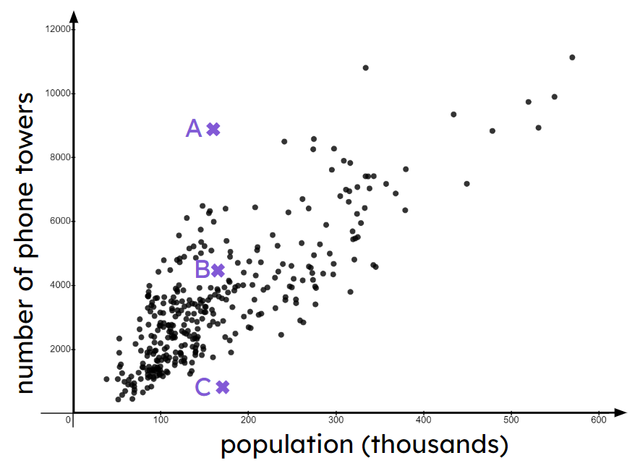
Q3.The scatter graph shows the population of some towns and the number of phone towers the town has. Each point in the scatter graph represents a town or region. Match each town with its statement.

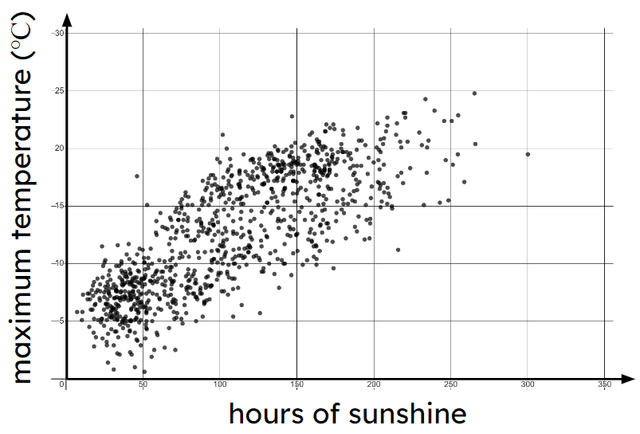
Q4.The scatter graph shows data about the sunshine duration and mean temperature for each month in a city. Which of the statements is the most valid?
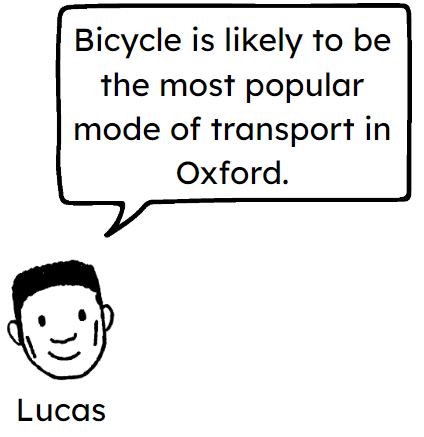
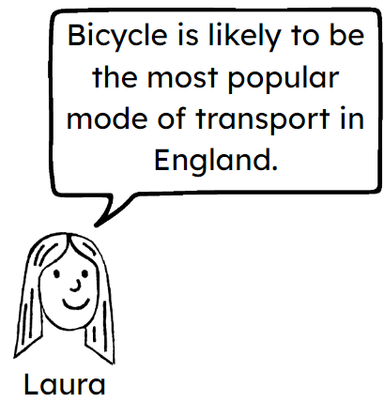
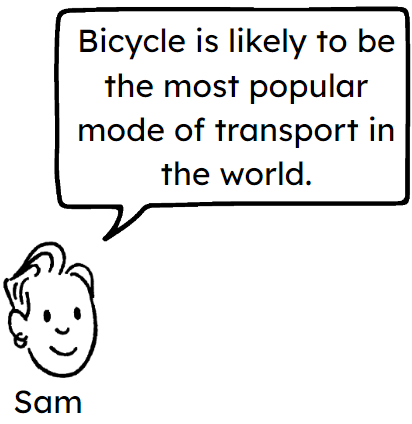
Q5.A data investigation surveys 100 people in Oxford about their preferred mode of transport. The most popular mode of transport was bicycle. Which is the most valid conclusion based on these results?
Q6. can be present in any sample collected from a population and may affect the results of a statistical investigation (e.g. only asking year 7 pupils what food should be served in the school).
To help you plan your 8 maths lesson on: Statistical problems - drawing conclusions, download all teaching resources for free and adapt to suit your pupils' needs...
To help you plan your 8 maths lesson on: Statistical problems - drawing conclusions, download all teaching resources for free and adapt to suit your pupils' needs.
The starter quiz will activate and check your pupils' prior knowledge, with versions available both with and without answers in PDF format.
We use learning cycles to break down learning into key concepts or ideas linked to the learning outcome. Each learning cycle features explanations with checks for understanding and practice tasks with feedback. All of this is found in our slide decks, ready for you to download and edit. The practice tasks are also available as printable worksheets and some lessons have additional materials with extra material you might need for teaching the lesson.
The assessment exit quiz will test your pupils' understanding of the key learning points.
Our video is a tool for planning, showing how other teachers might teach the lesson, offering helpful tips, modelled explanations and inspiration for your own delivery in the classroom. Plus, you can set it as homework or revision for pupils and keep their learning on track by sharing an online pupil version of this lesson.
Explore more key stage 3 maths lessons from the Numerical summaries of data unit, dive into the full secondary maths curriculum, or learn more about lesson planning.